手动实现legend 与 echarts图交互 通过js事件实现图标某项的高亮 显示与隐藏
通过html实现legend的样式 提供调用echarts的api实现与echarts图表交互的效果
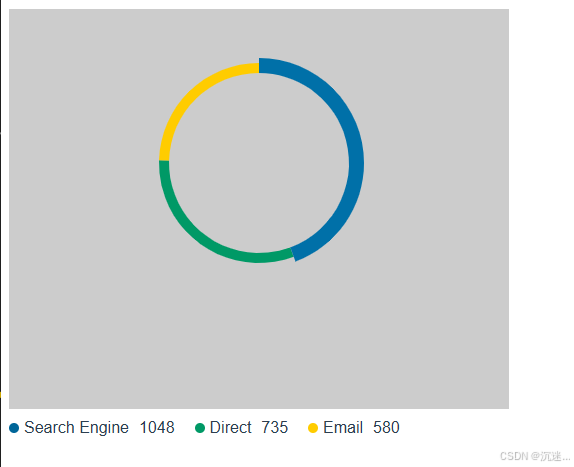
实现饼图element实现类似于legend与echartstu表交互效果
效果图
配置代码
<template><div style="height: 400px; width: 500px;background-color: #CCC;"><v-chart:option="options"autoresizestyle="width: 100%; height: 100%"ref="chart"/><div style="display: flex; margin-right: 20px"><divv-for="item in dataList":key="item.name"style="display: flex;align-items: center; margin-top: 10px; margin-right: 20px;cursor: pointer"@mouseenter="handleMouseenter(item)"@mouseleave="handleMouseleave(item)"@click="handleClick(item)"><i :style="{'background-color': item.isShow ? item.itemStyle.color: '#CCC'}" style="width: 10px;height:10px;border-radius: 50%;margin-right: 5px"></i><span style="margin-right:10px;">{{item.name}}</span><span>{{item.value}}</span></div></div></div>
</template><script>export default {name: 'AboutView',data() {return{dataList: [{ value: 1048, name: 'Search Engine',isShow: true,itemStyle: {color: '#006699'} },{ value: 735, name: 'Direct',isShow: true,itemStyle: {color: '#009966'}  },{ value: 580, name: 'Email',isShow: true,itemStyle: {color: '#FFCC00'}  },]}},computed: {options() {return {tooltip: {trigger: 'item'},legend:{show: false},series: [{name: 'Access From',type: 'pie',radius: ['45%', '50%'],center: ['50%', '38.5%'],avoidLabelOverlap: false,label: {show: false,position: 'center'},labelLine: {show: false},data: this.dataList}]}}},methods: {handleMouseenter(item){this.$refs.chart.dispatchAction({type: 'highlight',name: item.name,// seriesIndex: 1// dataIndex: 1// // 用 index 或 id 或 name 来指定系列。// // 可以使用数组指定多个系列。// seriesIndex?: number | number[],// seriesId?: string | string[],// seriesName?: string | string[],// // 数据项的 index,如果不指定也可以通过 name 属性根据名称指定数据项// dataIndex?: number | number[],// // 可选,数据项名称,在有 dataIndex 的时候忽略// name?: string | string[],})},handleMouseleave(item){this.$refs.chart.dispatchAction({type: 'downplay',name: item.name,// seriesIndex: 1// dataIndex: 1// // 用 index 或 id 或 name 来指定系列。// // 可以使用数组指定多个系列。// seriesIndex?: number | number[],// seriesId?: string | string[],// seriesName?: string | string[],// // 数据项的 index,如果不指定也可以通过 name 属性根据名称指定数据项// dataIndex?: number | number[],// // 可选,数据项名称,在有 dataIndex 的时候忽略// name?: string | string[],})},handleClick(item){item.isShow = !item.isShowthis.$refs.chart.dispatchAction({type: 'legendToggleSelect',name: item.name,// // 用 index 或 id 或 name 来指定系列。// // 可以使用数组指定多个系列。// seriesIndex?: number | number[],// seriesId?: string | string[],// seriesName?: string | string[],// // 数据项的 index,如果不指定也可以通过 name 属性根据名称指定数据项// dataIndex?: number | number[],// // 可选,数据项名称,在有 dataIndex 的时候忽略// name?: string | string[],})}}}
</script><style lang="scss" scoped></style>
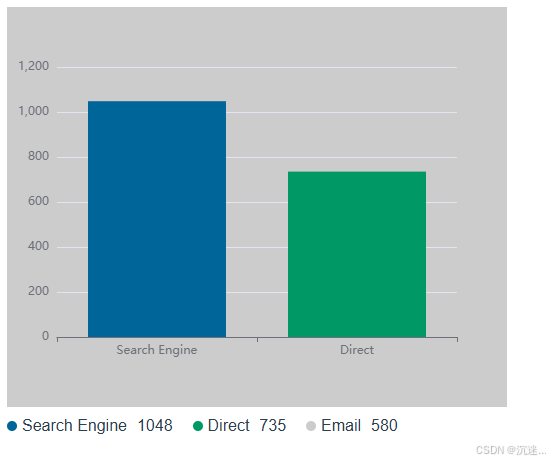
通过js实现柱形图同一组数据时 隐藏某一个柱子
效果图
配置代码
<template><div style="height: 400px; width: 500px;background-color: #CCC;"><v-chart:option="options"autoresizestyle="width: 100%; height: 100%"ref="chart"/><div style="display: flex; margin-right: 20px"><divv-for="item in dataList":key="item.name"style="display: flex;align-items: center; margin-top: 10px; margin-right: 20px;cursor: pointer"@click="handleClick(item)"@mouseenter="handleMouseenter(item)"@mouseleave="handleMouseleave(item)"><i :style="{'background-color': item.isShow ? item.itemStyle.color: '#CCC'}" style="width: 10px;height:10px;border-radius: 50%;margin-right: 5px"></i><span style="margin-right:10px;">{{item.name}}</span><span>{{item.value}}</span></div></div></div>
</template><script>export default {name: 'AboutView',data() {return{dataList: [{ value: 1048, name: 'Search Engine',isShow: true,itemStyle: {color: '#006699'} },{ value: 735, name: 'Direct',isShow: true,itemStyle: {color: '#009966'}  },{ value: 580, name: 'Email',isShow: true,itemStyle: {color: '#FFCC00'}  },]}},computed: {options() {return {tooltip: {trigger: 'item'},legend:{show: false},xAxis: {type: 'category',data: this.computedSeriesData.map(item => item.name)},yAxis: {type: 'value'},series: [{name: 'Access From',type: 'bar',radius: ['45%', '50%'],center: ['50%', '38.5%'],avoidLabelOverlap: false,label: {show: false,position: 'center'},labelLine: {show: false},data: this.computedSeriesData}]}},computedSeriesData() {return this.dataList.filter(item => item.isShow)}},methods: {handleClick(item){item.isShow = !item.isShow},handleMouseenter(item){this.$refs.chart.dispatchAction({type: 'highlight',name: item.name,// seriesIndex: 1// dataIndex: 1// // 用 index 或 id 或 name 来指定系列。// // 可以使用数组指定多个系列。// seriesIndex?: number | number[],// seriesId?: string | string[],// seriesName?: string | string[],// // 数据项的 index,如果不指定也可以通过 name 属性根据名称指定数据项// dataIndex?: number | number[],// // 可选,数据项名称,在有 dataIndex 的时候忽略// name?: string | string[],})},handleMouseleave(item){this.$refs.chart.dispatchAction({type: 'downplay',name: item.name,// seriesIndex: 1// dataIndex: 1// // 用 index 或 id 或 name 来指定系列。// // 可以使用数组指定多个系列。// seriesIndex?: number | number[],// seriesId?: string | string[],// seriesName?: string | string[],// // 数据项的 index,如果不指定也可以通过 name 属性根据名称指定数据项// dataIndex?: number | number[],// // 可选,数据项名称,在有 dataIndex 的时候忽略// name?: string | string[],})},}}
</script><style lang="scss" scoped></style>
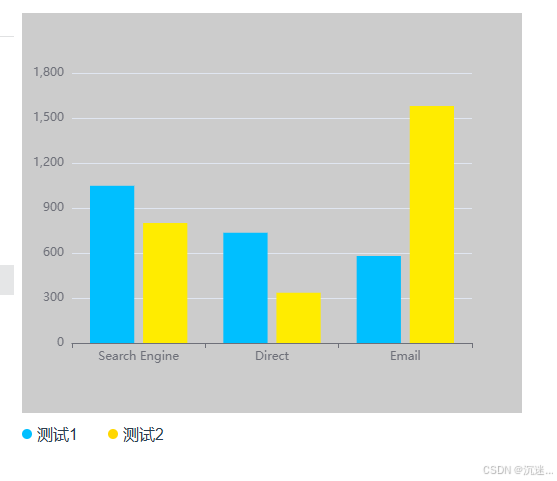
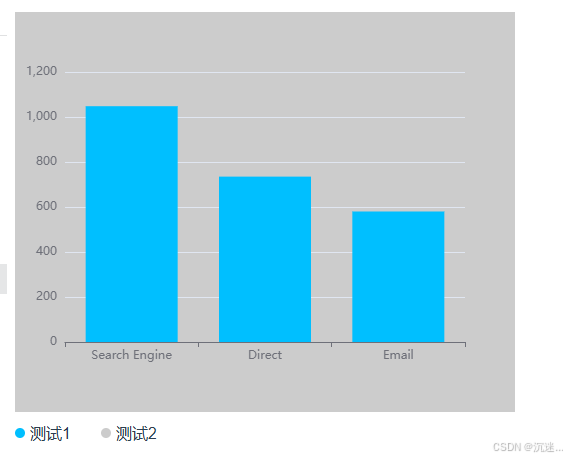
通过js实现柱形图一组数据的显示隐藏 达到legend的效果
效果图
配置代码
<template><div style="height: 400px; width: 500px;background-color: #CCC;"><v-chart:option="options"autoresizestyle="width: 100%; height: 100%"ref="chart"/><div style="display: flex; margin-right: 20px"><divv-for="item in legendList":key="item.name"style="display: flex;align-items: center; margin-top: 10px; margin-right: 20px;cursor: pointer"@click="handleClick(item)"@mouseenter="handleMouseenter(item)"@mouseleave="handleMouseleave(item)"><i :style="{'background-color': item.isShow ? item.color: '#CCC'}" style="width: 10px;height:10px;border-radius: 50%;margin-right: 5px"></i><span style="margin-right:10px;">{{item.name}}</span><span>{{item.value}}</span></div></div></div>
</template><script>export default {name: 'AboutView',data() {return{legendList: [{ name: '测试1', isShow: true, color: '#00BFFF' },{ name: '测试2', isShow: true, color: '#FFD700'},],dataList1: [{ value: 1048, name: 'Search Engine' },{ value: 735, name: 'Direct'},{ value: 580, name: 'Email'},],dataList2: [{ value: 800, name: 'Search Engine' },{ value: 335, name: 'Direct'},{ value: 1580, name: 'Email'},]}},computed: {options() {return {tooltip: {trigger: 'item'},legend:{show: false},xAxis: {type: 'category',data: this.dataList1.map(item => item.name)},yAxis: {type: 'value'},series: [{name: '测试1',type: 'bar',radius: ['45%', '50%'],center: ['50%', '38.5%'],avoidLabelOverlap: false,label: {show: false,position: 'center'},labelLine: {show: false},itemStyle:{color: '#00BFFF'},data: this.dataList1},{name: '测试2',type: 'bar',radius: ['45%', '50%'],center: ['50%', '38.5%'],avoidLabelOverlap: false,label: {show: false,position: 'center'},labelLine: {show: false},itemStyle:{color: '#FFD700'},data: this.dataList2}]}},},methods: {handleClick(item){item.isShow = !item.isShowthis.$refs.chart.dispatchAction({type: 'legendToggleSelect',// 图例名称name: item.name,// // 下列参数自 v5.6.0 起开始支持// // 图例组件ID// legendId: string,// // 图例组件索引// legendIndex: number,// // 图例组件名称// legendName: string})},handleMouseenter(item){this.$refs.chart.dispatchAction({type: 'highlight',seriesName: item.name// seriesIndex: 1// dataIndex: 1// // 用 index 或 id 或 name 来指定系列。// // 可以使用数组指定多个系列。// seriesIndex?: number | number[],// seriesId?: string | string[],// seriesName?: string | string[],// // 数据项的 index,如果不指定也可以通过 name 属性根据名称指定数据项// dataIndex?: number | number[],// // 可选,数据项名称,在有 dataIndex 的时候忽略// name?: string | string[],})},handleMouseleave(item){this.$refs.chart.dispatchAction({type: 'downplay',seriesName: item.name// seriesIndex: 1// dataIndex: 1// // 用 index 或 id 或 name 来指定系列。// // 可以使用数组指定多个系列。// seriesIndex?: number | number[],// seriesId?: string | string[],// seriesName?: string | string[],// // 数据项的 index,如果不指定也可以通过 name 属性根据名称指定数据项// dataIndex?: number | number[],// // 可选,数据项名称,在有 dataIndex 的时候忽略// name?: string | string[],})},}}
</script><style lang="scss" scoped></style>