GEE入门篇|遥感专业术语(实践操作4):光谱分辨率(Spectral Resolution)
目录
光谱分辨率(Spectral Resolution)
1.MODIS
2.EO-1
光谱分辨率(Spectral Resolution)
光谱分辨率是指传感器进行测量的光谱带的数量和宽度。 您可以将光谱带的宽度视为每个波段的波长间隔,在多个波段测量辐射亮度的传感器称为多光谱传感器(通常为 3-10 个波段),而具有多个波段(可能数百个)的传感器称为高光谱传感器。 然而,这些都是相对术语,没有普遍接受的定义。让我们将多光谱 MODIS 仪器与 EO-1 卫星上的高光谱 Hyperion 传感器进行比较,该传感器也可在 Earth Engine 中使用。
1.MODIS
有一种简单的方法可以检查图像中的波段数量,在此之前,如同我们在前面内容中所做的那样,搜索“modis500”并导入“MOD09A1.061 Terra Surface Reflectance 8-day Global 500 m”数据集, 将其命名为mod09,以下代码是查看modis图像中的波段数量,前几句代码是定义了一个兴趣点,我们查看的图像的波段就数量是这个兴趣点的。
// Define a region of interest as a point at San Francisco airport.
var sfoPoint = ee.Geometry.Point(-122.3774, 37.6194);
// Center the map at that point.
Map.centerObject(sfoPoint, 16);
// MODIS
// Get an image from your imported MODIS MYD09GA collection.
var modisImage = mod09.filterDate('2020-02-01', '2020-03-01').first();
// Use these MODIS bands for near infrared, red, and green,respectively.
var modisBands = ['sur_refl_b02', 'sur_refl_b01','sur_refl_b04'];
// Define visualization parameters for MODIS.
var modisVis = {
    bands: modisBands,
    min: 0,
    max: 3000
    };
// Add the MODIS image to the map.
Map.addLayer(modisImage, modisVis, 'MODIS');
/
// Explore spectral resolution
/
// Get the MODIS band names as an ee.List
var modisBands = modisImage.bandNames();
// Print the list.
print('MODIS bands:', modisBands);
// Print the length of the list.
print('Length of the bands list:', modisBands.length());
注意,并非所有波段都是光谱波段。 正如我们对时间分辨率所做的那样,让我们绘制光谱带以检查光谱分辨率。 如果您对波段列表中的不同波段有疑问,请记住,您可以通过访问 Earth Engine 中的数据集信息页面或数据或卫星的网页来查找此信息。
// Graph the MODIS spectral bands (bands 11-17).
// Select only the reflectance bands of interest.
var reflectanceImage = modisImage.select(
'sur_refl_b01',
'sur_refl_b02',
'sur_refl_b03',
'sur_refl_b04',
'sur_refl_b05',
'sur_refl_b06',
'sur_refl_b07'
);
和之前一样,我们将自定义图表以使其更易于阅读。
// Define an object of customization parameters for the chart.
var options = {
  title: 'MODIS spectrum at SFO',
  hAxis: {
    title: 'Band'
    },
  vAxis: {
    title: 'Reflectance'
    },
  legend: {
   position: 'none'
    },
    pointSize: 3
};
并使用 ui.Chart.image.regions 函数创建图表。
// Make the chart.
var modisReflectanceChart = ui.Chart.image.regions({
    image: reflectanceImage,
    regions: sfoPoint
}).setOptions(options);
// Display the chart.
print(modisReflectanceChart);

图1 MODIS 的 TOA 反射率图
结果图表如图1 所示,使用右上角的展开按钮可以查看比打印到控制台的图表更大的图表版本。
2.EO-1
现在,让我们将 MODIS 与 EO-1 卫星的高光谱传感器进行比较, 搜索“eo-1”并导入“EO-1 Hyperion Hyperspectral Imager”数据集, 将其命名为 eo1,我们可以查看 EO-1 传感器的波段数。
// Get the EO-1 band names as a ee.List
var eo1Image = eo1.filterDate('2015-01-01', '2016-01-01').first();
// Extract the EO-1 band names.
var eo1Bands = eo1Image.bandNames();
// Print the list of band names.
print('EO-1 bands:', eo1Bands);
检查控制台中打印的频段列表,请注意高光谱仪器还提供了多少个波段,现在让我们像处理 MODIS 数据一样创建反射率图表。
// Create an options object for our chart.
var optionsEO1 = {
  title: 'EO1 spectrum',
  hAxis: {
  title: 'Band'
  },
  vAxis: {
    title: 'Reflectance'
    },
  legend: {
  position: 'none'
  },
  pointSize: 3
};
// Make the chart and set the options.
var eo1Chart = ui.Chart.image.regions({
  image: eo1Image,
  regions: ee.Geometry.Point([6.10, 81.12])
}).setOptions(optionsEO1);
// Display the chart.
print(eo1Chart);
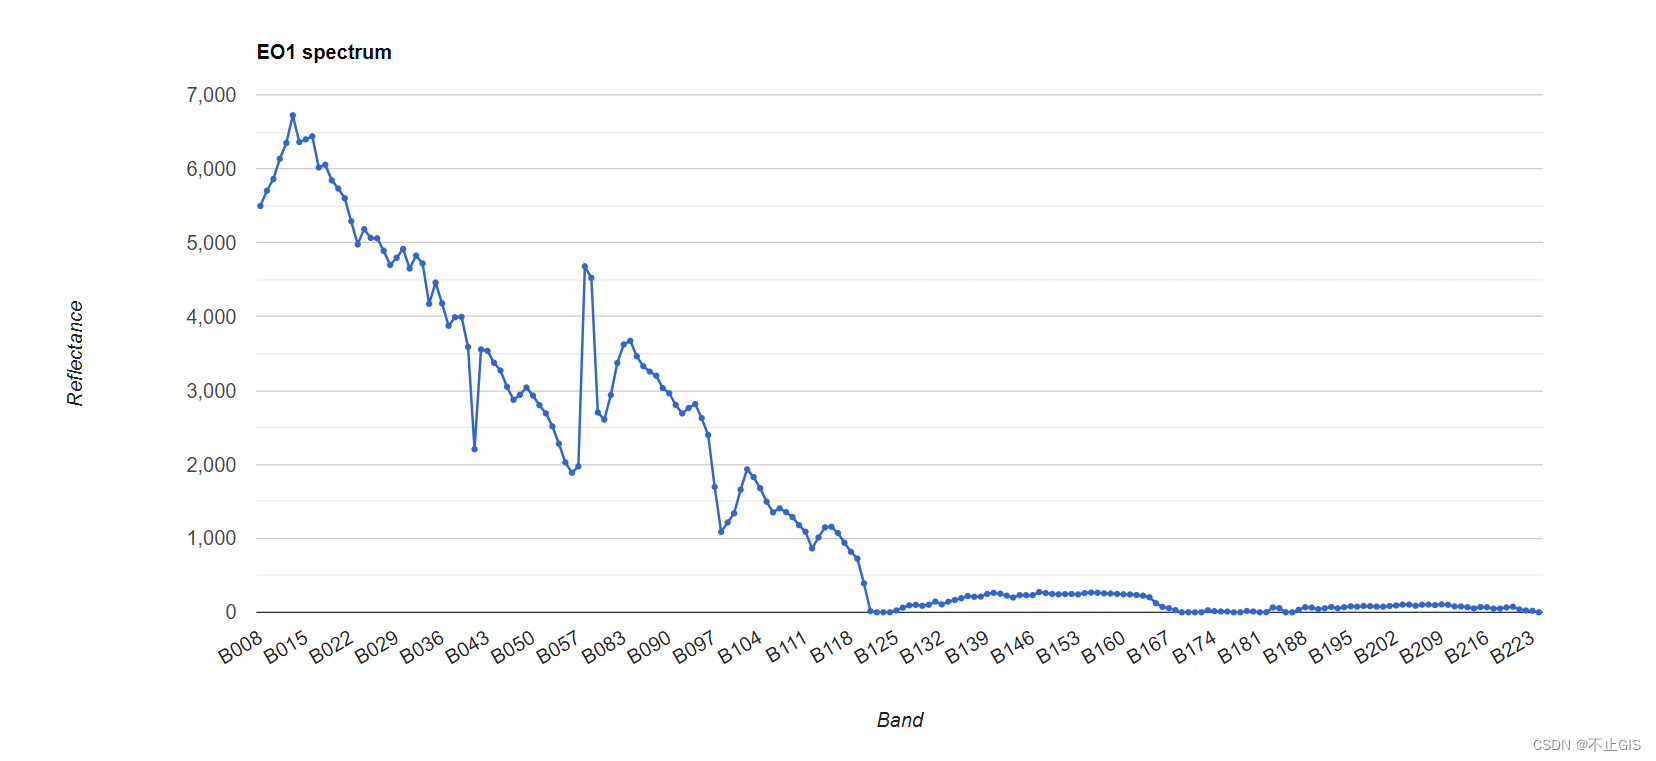
结果图表如图 2所示,波段太多了,名字只出现“……”!
 图 2 控制台中显示的 EO-1 TOA 反射率图, 注意展开按钮右上角的图表
 图3 EO-1 的 TOA 反射率展开图
如果我们点击图表右上角的展开图标,就可以更容易地看到波段标识符,如图 4.19 所示。 将此高光谱仪器图与我们的多光谱图进行比较上图为 MODIS。
