基于坐标的神经表示实现零样本学习以用于快速三维多参数定量磁共振成像|文献速递-深度学习医疗AI最新文献
Title
题目
Coordinate-based neural representation enabling zero-shot learning for fast 3D multiparametric quantitative MRI
基于坐标的神经表示实现零样本学习以用于快速三维多参数定量磁共振成像
01
文献速递介绍
定量磁共振成像(qMRI)能够对组织的弛豫时间($T_1$、$T_2$和$T_2^$)、水分子扩散率以及组织磁化率进行特定于组织的量化。这些参数为研究脑组织提供了独特的物理视角,有助于对局部微观结构环境进行详细的表征。 越来越多的证据表明,多参数定量磁共振成像有助于研究组织特征(本雅明尼等人,2023 年),例如对健康和患病大脑中的铁含量、髓鞘形成和细胞膜进行量化(内田等人,2019 年;索拉尼等人,2020 年;斯密茨,2021 年)。 然而,多参数定量图谱的绘制通常需要使用不同的磁共振成像序列进行多次扫描,也就是说,使用多回波自旋回波(ME-SE)序列进行$T_2$图谱绘制(本-埃利泽等人,2015 年),使用反转恢复自旋回波(IR-SE)序列进行$T_1$图谱绘制(邵等人,2017 年),以及使用多回波梯度回波(ME-GRE)序列进行$T_2^$图谱和磁化率图谱绘制(冯等人,2018 年)。这个过程会延长扫描时间,并可能导致图像之间出现配准误差,从而限制了其临床应用。 最近,同步多参数定量磁共振成像(MP-qMRI)发展迅速,已成为提高定量磁共振成像扫描效率的重要工具(陈等人,2018 年;王等人,2018 年;哈克等人,2020 年;孙等人,2020 年;梅泰雷等人,2017 年;马等人,2013 年;克里斯托杜洛等人,2018 年;王等人,2019 年;张等人,2022 年;王等人,2025 年)。 这些技术专门设计用于通过单次磁共振成像扫描获得配准的多个定量图谱,显著缩短了总扫描时间,并消除了图谱之间的空间配准误差。因此,同步多参数定量磁共振成像有望探索不同定量图谱之间的相互联系,并提高临床诊断的准确性。 在这些多参数定量磁共振成像技术中,STAGE(陈等人,2018 年;王等人,2018 年;哈克等人,2020 年)和多回波 MP2RAGE(孙等人,2020 年;梅泰雷等人,2017 年)能够通过单次采集生成磁敏感加权成像(SWI)、$T_1$、$T_2^$和定量磁化率图谱(QSM)图像。这些方法有效地平衡了采集效率和定量准确性,为多参数定量磁共振成像工作流程提供了有价值的见解。 最近开发的一些技术,如磁共振指纹成像(MRF)(马等人,2018 年;博亚乔格鲁等人,2021 年)、平面回波时间分辨成像(EPTI)(王等人,2019 年、2022 年)和磁共振多任务成像(克里斯托杜洛等人,2018 年;曹等人,2022 年),已证明能够同时生成三维的$T_1$、$T_2$、$T_2^$和 QSM 图像(李等人,2023 年;申等人,2021 年;陈等人,2021 年),为组织特性提供了更全面的表征,在灵敏度和可比性方面优于传统的定性磁共振成像。 这些技术捕捉由多种组织特性引起的信号演变,并将其编码到测量的频域(即 k 空间)中,然后对 k 空间进行稀疏采样以加快采集速度。因此,恢复组织的弛豫和磁化特性就变成了一个复杂的逆问题。 为应对这一挑战,人们提出了诸如字典匹配法(马等人,2013 年;比平·梅塔等人,2019 年)和基于低秩张量(LRT)的方法(张等人,2015 年;何等人,2016 年)等方法。然而,字典匹配法计算复杂度高,对于三维同步多参数定量磁共振成像来说不太实用,尤其是在字典规模较大和数据分辨率较高的情况下。 基于低秩张量的方法利用信号的时空相关性进行降维,从而能够从高度稀疏的测量数据中进行重建。虽然这种方法在平面回波时间分辨成像和磁共振多任务成像中很有前景,但这种重建方法涉及多个步骤,包括弛豫基估计、加权图像张量重建和布洛赫方程拟合。 因此,这些步骤中的任何一个出现误差都可能传播到最终的定量图谱重建中,影响定量准确性。此外,上述方法无法从多线圈 k 空间数据中同时恢复底层组织的定量参数和线圈灵敏度。它们总是需要根据预扫描计算出的线圈灵敏度图谱,这可能会引入误差并传播到后续的重建过程中。 因此,当前重建方法的局限性阻碍了同步多参数定量磁共振成像在成像速度和定量准确性方面的进一步提高。 近年来,深度网络在多参数定量磁共振成像重建领域显示出巨大的应用潜力(高等人,2021 年;程等人,2022 年;陆等人,2025 年)。例如,DCRNet(高等人,2021 年)采用了有监督的深度复数残差网络,从不相干的欠采样数据中重建幅度和相位图像,实现了对定量磁化率图谱和$T_2^$的高度加速同步采集。 然而,对大量训练数据的需求限制了有监督方法在各种多参数定量磁共振成像技术中的更广泛应用。相比之下,无监督深度学习策略克服了这一限制,无需额外的训练数据即可直接从欠采样测量数据中重建图像。 最近的一项研究,Joint-MAPLE 探索了一种用于同步多参数定量磁共振成像重建的无监督卷积神经网络(CNN)(海达里等人,2024 年)。该方法将卷积神经网络与展开的物理模型相结合,学习一系列加权图像,同时对定量参数图谱进行联合优化。 虽然这个过程避免了误差传播的问题,但 Joint-MAPLE 提供的定量磁共振成像参数图像数量有限,而且由于三维卷积神经网络的计算成本较高,其在更多参数方面的进一步应用可能会受到阻碍。此外,对低频信息的频谱偏差限制了基于卷积神经网络的结构捕捉图像细微细节的能力。 最近,隐式神经表示(INR)作为一种新的无监督学习范式应运而生,在医学图像重建方面取得了显著成果(沈等人,2022 年;冯等人,2024 年)。隐式神经表示通过训练多层感知器(MLP),将医学图像表示为一个连续函数,该函数将空间坐标映射到图像强度。 具体来说,隐式神经表示利用各种空间坐标编码技术(西兹曼等人,2020 年;坦西克等人,2020 年;吴等人,2023 年)来增强其捕捉高频图像细节的能力。从技术上讲,隐式神经表示在两个关键方面优于基于卷积神经网络的结构:(1)它缓解了卷积神经网络的低频偏差问题;(2)它为重建图像提供了空间连续的表示,事实证明,这对于整合各种成像正演模型更为实用。 因此,隐式神经表示在解决医学成像的复杂逆问题方面具有天然优势(吴等人,2022 年、2023 年;冯等人,2024 年;朱等人,2025 年;冯等人,2025 年),有望解决当前同步多参数定量磁共振成像重建中面临的挑战。 在本研究中,我们介绍了一种创新的成像方法,即通过隐式神经表示实现的三维同步多参数定量磁共振成像(SUMMIT)。SUMMIT 包括一个精心设计的数据采集过程,其采集时间与典型的临床扫描相当,以及一种基于隐式神经表示的创新型零样本多参数定量磁共振成像重建方法。 我们的方法将多种重要的组织定量特性编码到高度欠采样的多维 k 空间测量数据中。具体来说,所提出的成像序列采用了$T_2$准备的反转恢复和多回波梯度回波读出模块,将具有不同$T_2$权重的不同反转时间和回波时间的图像编码到 k 空间中。 此外,SUMMIT 利用隐式神经表示来解决欠采样 k 空间与磁参数定量图谱之间的不适定逆问题。它将底层组织的定量参数图谱和线圈灵敏度建模为空间坐标的连续函数,并以无监督的方式直接从欠采样的 k 空间测量数据中解码参数图谱。 在这种表示方式下,SUMMIT 在专门的物理模型的指导下,将同步多参数定量磁共振成像的多步骤复杂逆问题重新表述为单步骤函数参数优化问题。 得益于神经网络强大的拟合能力,我们的方法能够从高度欠采样的 k 空间数据中一步重建出配准的$T_1$、$T_2$、$T_2^$、定量磁化率图谱和亚体素定量磁化率图谱。 最后,SUMMIT 在可控的采集时间内生成了六种不同的高分辨率定量磁共振图像。据我们所知,SUMMIT 是单次数据采集后最全面的定量磁共振成像重建方法。 模拟和体模数据的结果表明,与现有方法相比,我们提出的方法具有优越性,在高加速因子下,$T_1$、$T_2$和$T_2^*$图谱的定量误差分别显著降低了 14.9%、19.6%和 8.4%。 在对白质高信号病变患者的病理分析中,SUMMIT 以高灵敏度和特异性独特地揭示了微观结构的变化,这进一步凸显了我们方法的临床应用潜力。 因此,我们相信 SUMMIT 能够同时检测多个定量磁共振成像参数中重要而复杂的变化,这对计算机辅助磁共振分析至关重要。
Aastract
摘要
Quantitative magnetic resonance imaging (qMRI) offers tissue-specific physical parameters with significantpotential for neuroscience research and clinical practice. However, lengthy scan times for 3D multiparametricqMRI acquisition limit its clinical utility. Here, we propose SUMMIT, an innovative imaging methodologythat includes data acquisition and an unsupervised reconstruction for simultaneous multiparametric qMRI.SUMMIT first encodes multiple important quantitative properties into highly undersampled k-space. It furtherleverages implicit neural representation incorporated with a dedicated physics model to reconstruct the desiredmultiparametric maps without needing external training datasets. SUMMIT delivers co-registered 𝑇1 , 𝑇2 , 𝑇2 ∗ ,and subvoxel quantitative susceptibility mapping. Extensive simulations, phantom, and in vivo brain imagingdemonstrate SUMMIT’s high accuracy. Notably, SUMMIT uniquely unravels microstructural alternations inpatients with white matter hyperintense lesions with high sensitivity and specificity. Additionally, the proposedunsupervised approach for qMRI reconstruction also introduces a novel zero-shot learning paradigm formultiparametric imaging applicable to various medical imaging modalities.
定量磁共振成像(qMRI)能够提供具有组织特异性的物理参数,在神经科学研究和临床实践中具有巨大的潜力。然而,三维多参数定量磁共振成像采集所需的长时间扫描限制了其临床应用。在此,我们提出了SUMMIT,这是一种创新的成像方法,涵盖了数据采集和用于同步多参数定量磁共振成像的无监督重建技术。 SUMMIT首先将多个重要的定量属性编码到高度欠采样的k空间中。它进一步利用结合了专门物理模型的隐式神经表示,在无需外部训练数据集的情况下重建出所需的多参数图谱。SUMMIT能够生成配准后的T₁、T₂、T₂*图谱,以及亚体素定量磁化率图谱。 大量的模拟实验、体模实验以及大脑的在体成像实验均表明,SUMMIT具有很高的准确性。值得注意的是,SUMMIT能够以高灵敏度和特异性,独特地揭示出患有白质高信号病变患者的微观结构变化。此外,所提出的用于定量磁共振成像重建的无监督方法,还为多参数成像引入了一种新颖的零样本学习范式,该范式适用于各种医学成像模态。
Method
方法
2.1. MRI sequence and data acquisition
As illustrated in Fig. 1(a), the MRI sequence consists of 𝑇2 -preparedinversion recovery (T2IR-prep) modules and ME-GRE readout (greencircle) with fast low angle shot (FLASH) excitations (blue arrows).𝑇*2 contrasts are generated by varying T2IR-prep durations 𝜏, 𝑇1 contrasts are determined by the inversion times (TI), and 𝑇 2 ∗ contrastsare produced by different echo times (TE) of the ME-GRE readout.This setup allows us to represent k-space as a multiple-dimensionaltensor 𝑆𝑘* (𝑘𝑥 , 𝑘𝑦 , 𝑘𝑧 , 𝑇 𝐼, 𝜏, 𝑇 𝐸) with three spatial dimensions (𝑘𝑥 , 𝑘𝑦 , 𝑘𝑧 )and three temporal dimensions (𝑇 𝐼, 𝜏, 𝑇 𝐸). Fully sampling this highdimensional k-space is time-consuming, so a highly undersampled strategy is necessary for accelerating the scan. To enhance sampling incoherence, we adopt a random Cartesian sampling pattern with a variabledensity Gaussian distribution along phase encoding directions (𝑘𝑦 and𝑘𝑧 ). The acceleration factor is defined as:𝑅 =𝑛𝑘𝑦∗ 𝑛𝑘𝑧𝑛𝑠𝑒𝑔𝑚𝑒𝑛𝑡 ∗ 𝑛𝑠𝑎𝑚𝑝𝑙𝑒𝑑, (1)where 𝑛𝑘𝑦and 𝑛𝑘𝑧are the steps of phase encoding, 𝑛𝑠𝑒𝑔𝑚𝑒𝑛𝑡 representsthe number of segments (FLASH excitations) within one inversionrecovery period, and 𝑛𝑠𝑎𝑚𝑝𝑙𝑒𝑑 is the number of sampled k-space pointsin the 𝑘𝑦 -𝑘𝑧 plane per segment.
2.1 磁共振成像序列与数据采集 如图 1(a) 所示,磁共振成像序列由$T_2$准备的反转恢复(T2IR-prep)模块和采用快速小角度激发(FLASH)脉冲(蓝色箭头)的多回波梯度回波(ME-GRE)读出模块(绿色圆圈)组成。 $T_2$对比度通过改变 T2IR-prep 的持续时间$\tau$来产生,$T_1$对比度由反转时间(TI)决定,而$T_2^*$对比度则由 ME-GRE 读出模块的不同回波时间(TE)产生。 这种设置使我们能够将 k 空间表示为一个多维张量$S_k$($k_x$,$k_y$,$k_z$,$TI$,$\tau$,$TE$),其中包含三个空间维度($k_x$,$k_y$,$k_z$)和三个时间维度($TI$,$\tau$,$TE$)。对这个高维 k 空间进行全采样非常耗时,因此为了加快扫描速度,采用高度欠采样策略是很有必要的。 为了增强采样的非相干性,我们采用了一种随机笛卡尔采样模式,在相位编码方向($k_y$和$k_z$)上采用可变密度的高斯分布。加速因子定义为: $R = \frac{n{k_y} \times n{k_z}}{n{segment} \times n{sampled}}$ (1) 其中,$n{k_y}$和$n{k_z}$是相位编码的步数,$n{segment}$表示一个反转恢复周期内的段数(即 FLASH 激发次数),$n{sampled}$是每段在$k_y - k_z$平面上采样的 k 空间点数。
Conclusion
结论
In this study, we developed a novel 3D multiparametric qMRIsequence and a zero-shot reconstruction strategy via coordinate-basedneural representation. The proposed imaging methodology encodes 𝑇1 ,𝑇*2 , 𝑇 2 ∗ , and phase maps into a high-dimensional k-space that is undersampled along the spatiotemporal dimensions. Then, we adopted theconcept of neural representation to model a series of unknown variablesas functions of spatial coordinates, enabling the direct reconstructionfrom k-space to quantitative maps, thereby eliminating the error propagation. The experimental results of numerical simulation and phantomdata demonstrate the advantages of the proposed direct reconstructionstrategy in enhancing quantitative accuracy. Additionally, experimentson in vivo data show that the imaging method can obtain co-registered3D 𝑇1 , 𝑇2 , 𝑇 2 ∗ , the derived QSM, and subvoxel QSM maps. The resultsof lesion data further reveal the application potential of the proposedmethod in neuroscience research.
在这项研究中,我们开发了一种新颖的三维多参数定量磁共振成像(qMRI)序列,以及一种通过基于坐标的神经表示实现的零样本重建策略。所提出的成像方法将(T_1)、(T_2)、(T_2^)和相位图谱编码到一个高维k空间中,该k空间在时空维度上进行了欠采样。 然后,我们采用神经表示的概念,将一系列未知变量建模为空间坐标的函数,从而能够直接从k空间重建出定量图谱,进而消除了误差传播。数值模拟和体模数据的实验结果证明了所提出的直接重建策略在提高定量准确性方面的优势。 此外,对在体数据的实验表明,该成像方法能够获得配准的三维(T_1)、(T_2)、(T_2^)图谱、由此衍生的定量磁化率图谱(QSM)以及亚体素QSM图谱。病变数据的实验结果进一步揭示了所提出的方法在神经科学研究中的应用潜力。
Results
结果
3.1. Ablation study
We investigated the effect of the finest hash grid resolution on therepresentation of reconstructed quantitative maps. The finest resolutionis primarily determined by the number of resolution levels 𝐿 andthe coarsest resolution 𝑁**𝑚𝑖𝑛. Fig. 2 plots the variations of NRMSEas a function of 𝐿 and 𝑁**𝑚𝑖𝑛. When the number of resolution levelsreaches 12, the quantitative maps exhibit lower NRMSE for each 𝑁**𝑚𝑖𝑛.These results suggest that the hash encoding used for quantitative maprepresentation is robust to variations in hash parameters, as long as theresulting finest resolution of the hash grid satisfies the requirements foraccurate quantitative map representation.
Fig. 3 illustrates the effect of the resolution of hash grids on therepresentation of sensitivity maps. As shown in Fig. 3(a), when 𝑁𝑚𝑖𝑛is fixed at 1, a single resolution level is insufficient for capturingvariations in coil sensitivity. As the resolution level increases, theaccuracy of coil sensitivity estimation improves, which in turn enhancesthe accuracy of other quantitative maps. Fig. 3(b) shows the results as afunction of 𝑁𝑚𝑖𝑛 with the resolution levels 𝐿 = 8. As 𝑁**𝑚𝑖𝑛 increases, thefinest resolution of the hash grid improves, reducing the smoothnessconstraint on coil sensitivity. This leads to unreliable coil sensitivitymaps, resulting in substantial errors in the estimation of reconstructedquantitative maps.In addition, we evaluated the impact of the WNNM loss on the 4×undersampled data with a low SNR of 10. The comparisons in Fig.4 demonstrate the effectiveness of WNNM loss, with significant noisreductions on 𝑇1 , 𝑇2 and 𝑇 2 ∗ maps. The numerical results with WNNMloss also reveal a reduction in NRMSE by 2.7%, 5.5%, and 2.0% on 𝑇1 ,𝑇2 , and 𝑇 2 ∗ maps, respectively, compared to the results without WNNMloss.
3.1 消融研究 我们研究了最精细的哈希网格分辨率对重建的定量图谱表示的影响。最精细的分辨率主要由分辨率级别数量(L)和最粗分辨率(N{min})决定。图2绘制了归一化均方根误差(NRMSE)随(L)和(N{min})变化的情况。当分辨率级别数量达到(12)时,对于每个(N{min})值,定量图谱的归一化均方根误差都较低。 这些结果表明,用于定量图谱表示的哈希编码对哈希参数的变化具有鲁棒性,只要哈希网格最终的最精细分辨率满足准确定量图谱表示的要求即可。 图3展示了哈希网格分辨率对敏感度图谱表示的影响。如图3(a)所示,当(N{min})固定为(1)时,单一的分辨率级别不足以捕捉线圈灵敏度的变化。随着分辨率级别的增加,线圈灵敏度估计的准确性提高,进而提高了其他定量图谱的准确性。图3(b)展示了在分辨率级别(L = 8)时,结果随(N{min})变化的情况。随着(N{min})的增加,哈希网格的最精细分辨率提高,降低了对线圈灵敏度的平滑度约束。这会导致线圈灵敏度图谱不可靠,从而在重建的定量图谱估计中产生较大误差。 此外,我们评估了加权核范数最小化(WNNM)损失函数对信噪比为(10)的(4)倍欠采样数据的影响。图4中的比较结果证明了WNNM损失函数的有效性,它在(T_1)、(T_2)和(T_2^)图谱上显著降低了噪声。与不使用WNNM损失函数的结果相比,使用WNNM损失函数的数值结果还显示,(T_1)、(T_2)和(T_2^)图谱的归一化均方根误差分别降低了(2.7\%)、(5.5\%)和(2.0\%)。
Figure
图
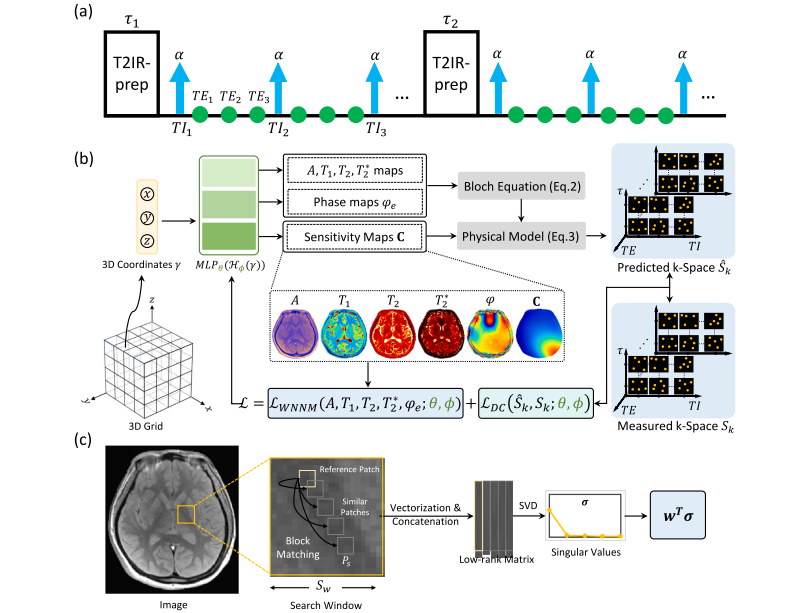
Fig. 1. Overview of SUMMIT. (a) Diagram of the MRI sequence for data acquisition. (b) The reconstruction process of SUMMIT. The 3D coordinates 𝛾 are fed into the encodingmodule 𝐻𝜙 and 𝑀𝐿𝑃𝜃 to simultaneously estimate the multiparametric quantitative maps and sensitivity maps. The predicted multiple-dimensional k-space ̂𝑆𝑘 is generated throughthe Bloch equation and the physical forward model based on the estimated maps. The weights in the MLP and encoding module are optimized by minimizing the data consistency(DC) loss and weighted nuclear norm minimization (WNNM) loss. (c) The denoising procedure of WNNM module. First, similar patches are extracted through block matching.These patches are then vectorized and concatenated along one dimension to construct a low-rank matrix. Finally, singular value decomposition (SVD) is performed to obtain aseries of singular values 𝜎. The WNNM loss is a weighted sum of the singular values.
图1:SUMMIT概述。(a)用于数据采集的磁共振成像(MRI)序列示意图。(b)SUMMIT的重建过程。将三维坐标γ输入到编码模块𝐻𝜙和多层感知器(MLP)𝑀𝐿𝑃𝜃中,以同时估计多参数定量图谱和敏感度图谱。基于估计得到的图谱,通过布洛赫方程和物理正演模型生成预测的多维k空间 ̂𝑆𝑘 。通过最小化数据一致性(DC)损失和加权核范数最小化(WNNM)损失来优化多层感知器和编码模块中的权重。(c)加权核范数最小化(WNNM)模块的去噪过程。首先,通过块匹配提取相似的图像块。然后将这些图像块向量化,并沿一个维度连接起来以构建一个低秩矩阵。最后,进行奇异值分解(SVD)以得到一系列奇异值𝜎。加权核范数最小化损失是奇异值的加权和。
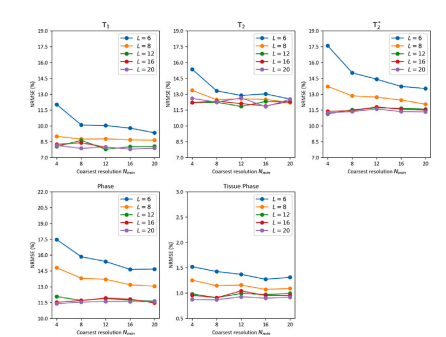
Fig. 2. Variations of NRMSE as a function of the number of resolution levels 𝐿 andthe coarse resolution 𝑁𝑚𝑖𝑛 for the hash grids used to represent the quantitative maps.
图2:归一化均方根误差(NRMSE)随用于表示定量图谱的哈希网格的分辨率级别数量(L)和粗分辨率(N_{min})的变化情况。
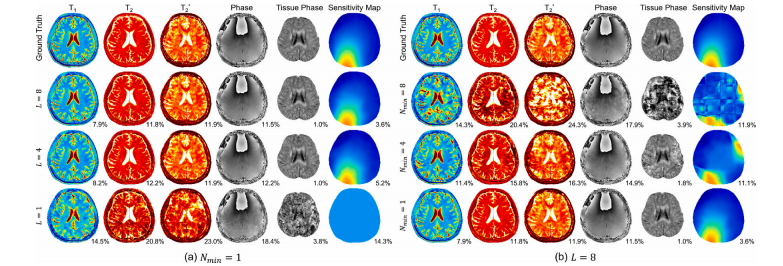
Fig. 3. The differences between our BRC and previous text-guided methods. (a)This shows the implementation of our BRC in text-vision pre-training. Our BRCframework constructs multi-level contrastive learning and intra-modal and inter-modalbacktracking mapping mechanisms. (b) This shows the implementation of our BRCframework on downstream segmentation tasks. Our BRC framework builds intra-modalattention mechanisms and inter-modal attention mechanisms. This propagates usefulinformation from text to dense prediction visual tasks
图3:我们的双向循环(BRC)框架与先前文本引导方法的差异。(a) 此图展示了我们的BRC在文本-视觉预训练中的实现方式。我们的BRC框架构建了多层次对比学习以及模态内和跨模态回溯映射机制。(b) 此图展示了我们的BRC框架在下游分割任务中的实现。我们的BRC框架建立了模态内注意力机制和跨模态注意力机制。这将文本中的有用信息传播到密集预测视觉任务中。
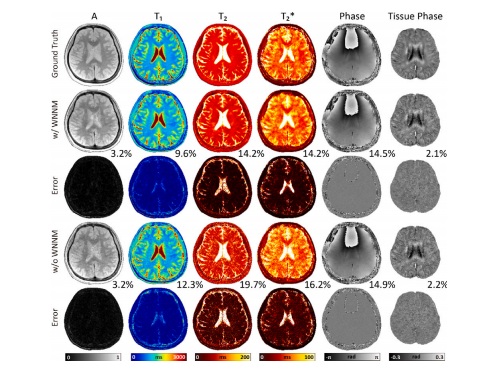
Fig. 4. Comparison between SUMMIT with and without WNNM loss on the 4×retrospective simulations with a low SNR = 10. The corresponding NRMSE values areindicated below each result.
图4:在信噪比低至(10)的(4)倍回顾性模拟中,带有和不带有加权核范数最小化(WNNM)损失函数的SUMMIT方法的对比。每个结果下方都标注了相应的归一化均方根误差(NRMSE)值。
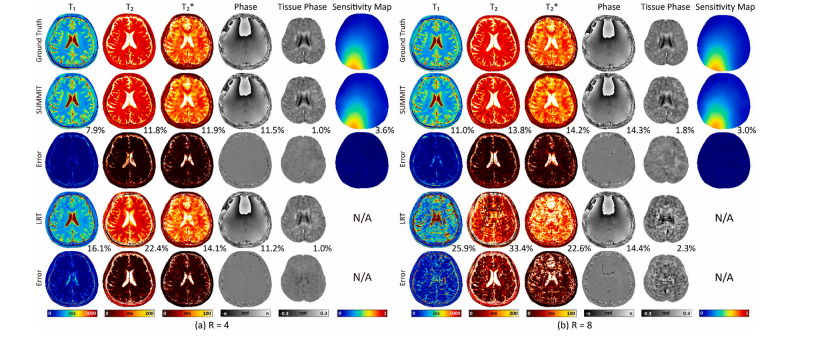
Fig. 5. Comparison between SUMMIT and LRT on the (a) 4× and (b) 8× retrospective simulations. The ground truth maps used for simulation are shown in the first row.The reconstructed maps of SUMMIT and LRT are shown in the second and fourth rows respectively, with the corresponding NRMSE values indicated below each result. Thecorresponding errors of quantitative maps are shown in the third and fifth rows.
图5:SUMMIT方法与基于低秩张量(LRT)的方法在(a)4倍和(b)8倍回顾性模拟中的对比。用于模拟的真实图谱显示在第一行。SUMMIT方法和LRT方法重建的图谱分别显示在第二行和第四行,每个结果下方都标注了相应的归一化均方根误差(NRMSE)值。定量图谱相应的误差显示在第三行和第五行。
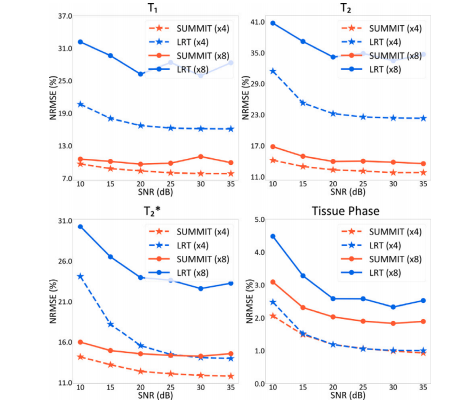
Fig. 6. The performance variation of SUMMIT and LRT on the 4× and 8× retrospectivesimulation with different SNRs. SUMMIT shows lower NRMSE of 𝑇1 , 𝑇2 , and 𝑇2 ∗ mapscompared with LRT
图6:在不同信噪比条件下,SUMMIT方法和基于低秩张量(LRT)的方法在4倍和8倍回顾性模拟中的性能变化情况。与LRT方法相比,SUMMIT方法在\(T_1\)、\(T_2\)和\(T_2^*\)图谱上显示出更低的归一化均方根误差(NRMSE)。
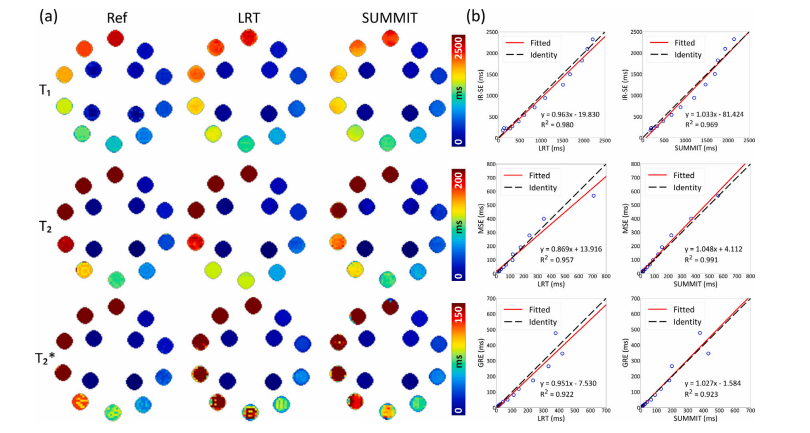
Fig. 7. Quantitative evaluation on a standard phantom. (a) SUMMIT shows good image quality on the 𝑇1 , 𝑇2 , and 𝑇2 ∗ maps, and agrees well with the references (Ref). Thosemaps from LRT show non-uniformity on the phantom due to the potential reconstruction errors. (b) The correlation analysis indicates SUMMIT correlates well with the referencesequences, as denoted by the coefficient of determination and slope approaching 1. The red line represents the linear regression fitting and the black dashed line corresponds toy = x.
图7:对标准体模的定量评估。(a)SUMMIT方法在\(T_1\)、\(T_2\)和\(T_2^*\)图谱上展现出良好的图像质量,并且与参考结果(Ref)吻合度很高。基于低秩张量(LRT)方法得到的那些图谱,由于潜在的重建误差,在体模上呈现出不均匀性。(b)相关性分析表明,SUMMIT方法与参考序列的相关性很好,这表现为决定系数和斜率都趋近于1。红线表示线性回归拟合线,黑色虚线对应于\(y = x\)这条线。
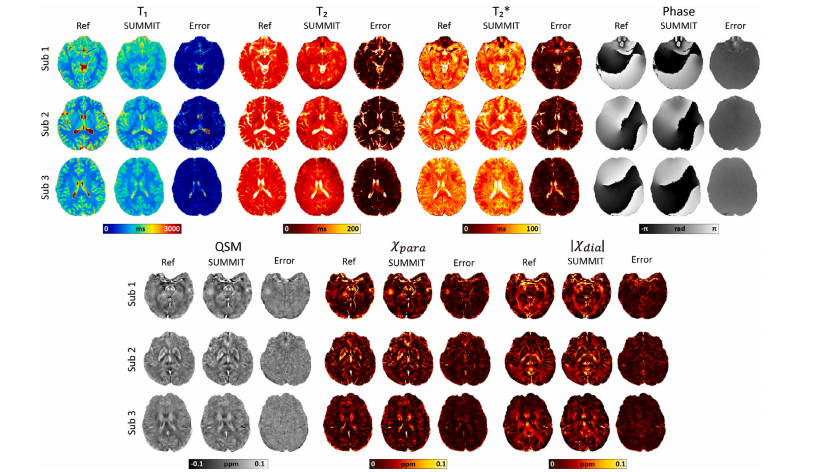
Fig. 8. The in vivo evaluation on ten healthy volunteers. The representative slices of 𝑇1 , 𝑇2 , 𝑇2 ∗ , phase, QSM, and subvoxel QSM (including 𝜒𝑝𝑎𝑟𝑎 and 𝜒𝑑𝑖𝑎) images using SUMMIT,and the corresponding quantitative maps acquired from the reference sequences (Ref). SUMMIT provides good overall spatial agreement with the references.
图8:对十名健康志愿者进行的在体评估。展示了使用SUMMIT方法得到的(T_1)、(T_2)、(T_2^*)、相位、定量磁化率图谱(QSM)以及亚体素QSM(包括平行磁化率(\chi{para})和垂直磁化率(\chi{dia}))图像的代表性切片,以及从参考序列(Ref)获取的相应定量图谱。SUMMIT方法在整体空间上与参考结果具有良好的一致性。
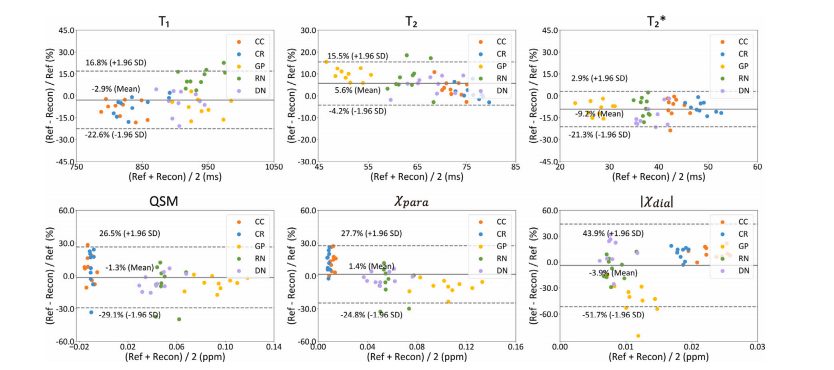
Fig. 9. Bland-Altman analyses of 𝑇1 , 𝑇2 , 𝑇2 ∗ ,QSM, and subvoxel QSM on five ROIs from SUMMIT reconstruction and references (N = 10). The solid lines indicate mean percentagedifferences and the dashed lines represent the 95% confidence level
图9:对通过SUMMIT重建得到的以及参考结果((N = 10))中五个感兴趣区域(ROI)的(T_1)、(T_2)、(T_2^*)、定量磁化率图谱(QSM)和亚体素QSM进行的布兰德-奥特曼(Bland-Altman)分析。实线表示平均百分比差异,虚线表示95%置信区间水平。
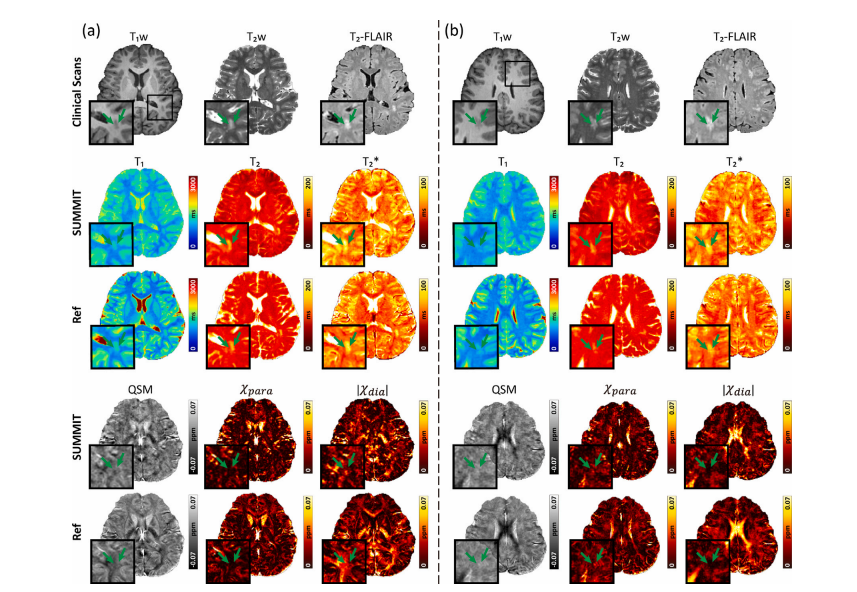
Fig. 10. Multiparametric quantitative maps on a volunteer with white matter hyperintensities. (a) The representative slice at the location with white matter hyperintensities. (b) Theother slice indicates white matter hyperintensities. The clinical weighted images (𝑇1𝑤, 𝑇2𝑤, and 𝑇2 -FLAIR) are shown in the first row, the quantitative maps of SUMMIT are shownin the second and fourth rows, and the corresponding references (Ref) are shown in the third and fifth rows. Green arrows point to the region of white matter hyperintensities.SUMMIT reflects the tissue abnormality indicated by the clinical images. The 𝜒𝑑𝑖𝑎 image in (a) exhibits normal signal intensity while that in (b) displays hypointensity related tothe surrounding tissue.
图10:一位患有白质高信号病变志愿者的多参数定量图谱。(a)白质高信号病变位置的代表性切片。(b)另一个显示白质高信号病变的切片。第一行展示了临床加权图像((T_1)加权、(T_2)加权和(T_2)液体衰减反转恢复序列((T_2)-FLAIR)),第二行和第四行展示了SUMMIT方法得到的定量图谱,第三行和第五行展示了相应的参考图谱(Ref)。绿色箭头指向白质高信号病变区域。SUMMIT方法反映出了临床图像所显示的组织异常情况。(a)中的垂直磁化率((\chi_{dia}))图像显示出正常的信号强度,而(b)中的该图像与周围组织相比显示出低信号强度。
Table
表
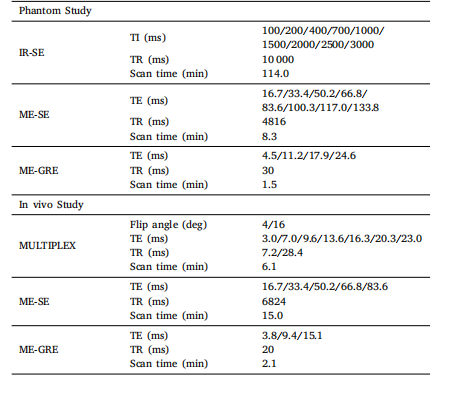
Table 1Imaging protocols of reference scans for MRI experiments.
表1磁共振成像(MRI)实验中参考扫描的成像协议。