Perf学习
重要的能解决的问题是这些:
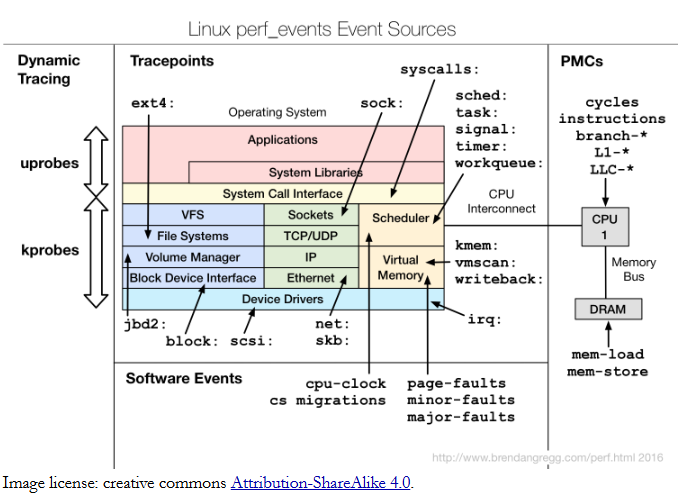
perf_events is an event-oriented observability tool, which can help you solve advanced performance and troubleshooting functions. Questions that can be answered include:
- Why is the kernel on-CPU so much? What code-paths?
- Which code-paths are causing CPU level 2 cache misses?
- Are the CPUs stalled on memory I/O?
- Which code-paths are allocating memory, and how much?
- What is triggering TCP retransmits?
- Is a certain kernel function being called, and how often?
- What reasons are threads leaving the CPU?
原文地址:Linux perf Examples
=====================