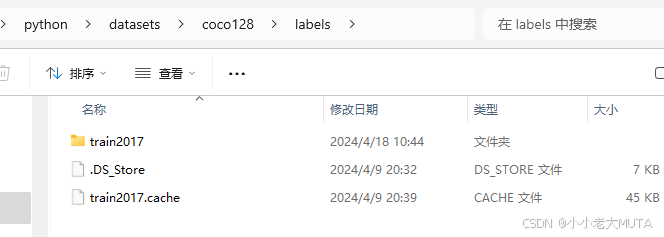
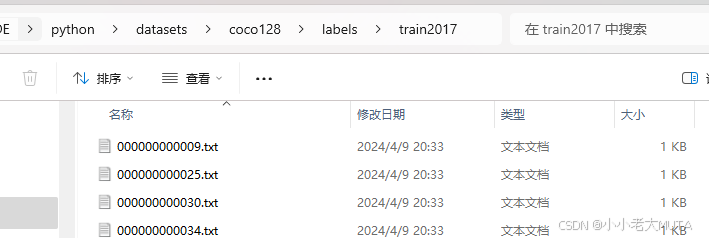
coco128数据集格式
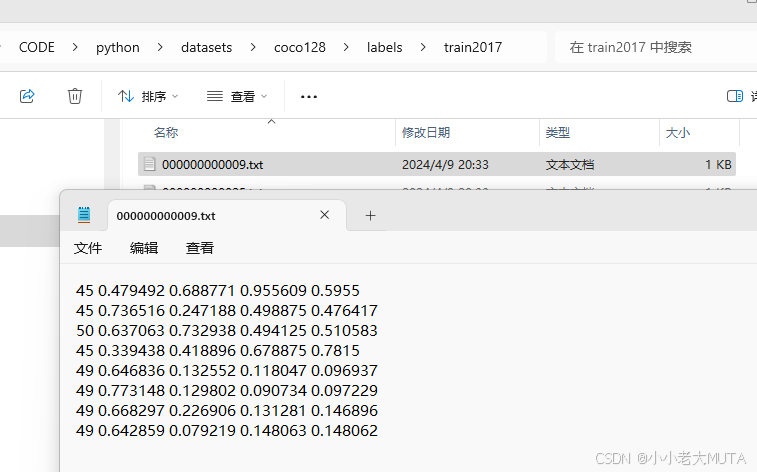
一、数据集内容
每一行表示一个目标的信息:5个字段(
class_id, x_center, y_center, width, height)
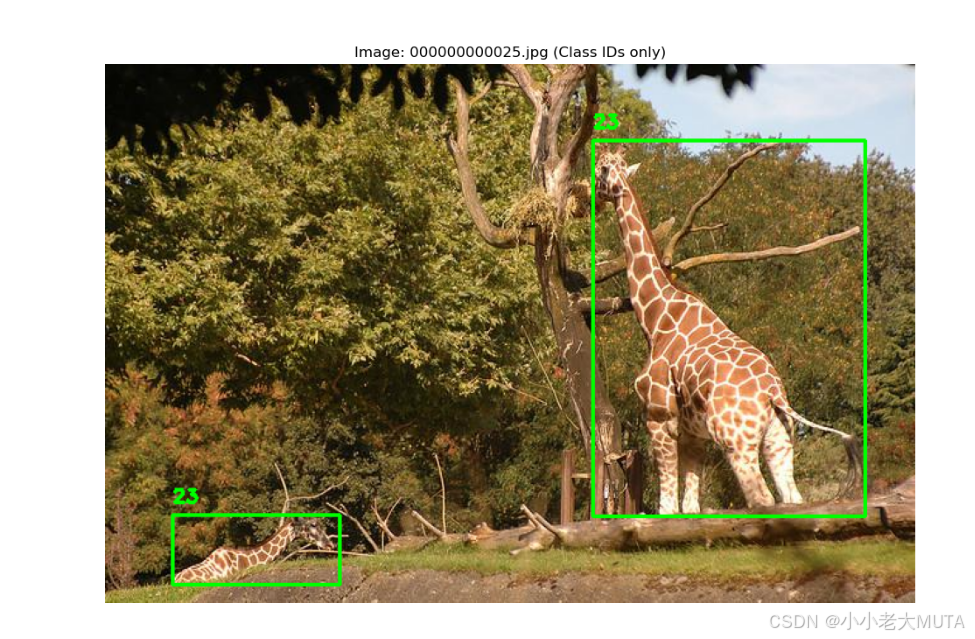
二、可视化标注框与类别
import os
import cv2
import matplotlib.pyplot as plt# 设置路径
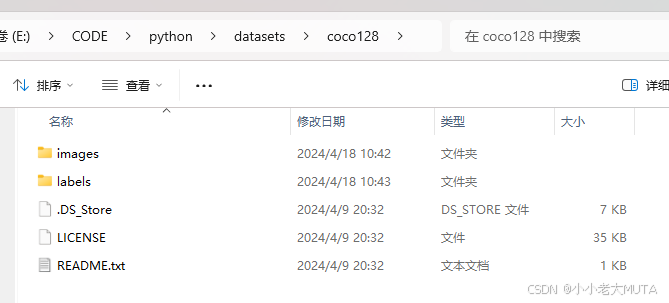
data_dir = "F:/datasets/coco128" # 替换为你的实际路径
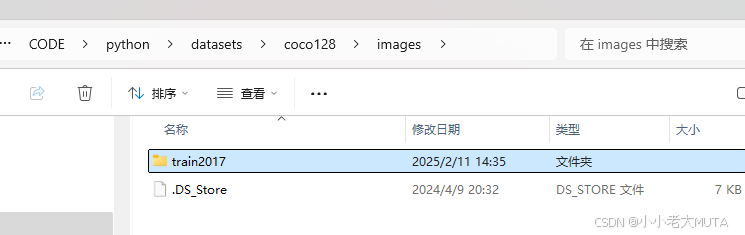
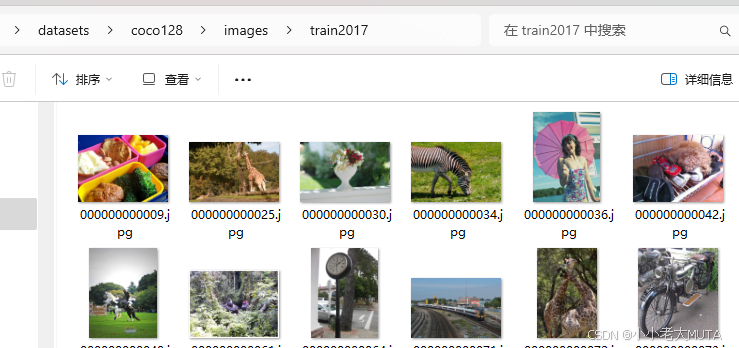
image_folder = os.path.join(data_dir, "images/train2017") # 选择train/val/test
label_folder = os.path.join(data_dir, "labels/train2017") # 对应标签文件夹# 手动指定图像文件名(例如:"0000001.jpg")
target_image_name = "000000000025.jpg" # 修改为目标图像名
image_path = os.path.join(image_folder, target_image_name)
label_path = os.path.join(label_folder, os.path.splitext(target_image_name)[0] + '.txt')# 检查文件是否存在
if not os.path.exists(image_path):print(f"错误:图像文件 {image_path} 不存在!")exit()
if not os.path.exists(label_path):print(f"错误:标签文件 {label_path} 不存在!")exit()# 读取图像
image = cv2.imread(image_path)
image = cv2.cvtColor(image, cv2.COLOR_BGR2RGB) # 转换为RGB格式
img_h, img_w = image.shape[:2] # 获取图像高宽# 读取并绘制YOLO标签
with open(label_path, 'r') as f:for line in f.readlines():parts = line.strip().split()if len(parts) < 5:continue # 跳过格式错误的行class_id, x_center, y_center, width, height = map(float, parts[:5])# 转换为绝对坐标(像素值)x_center *= img_wy_center *= img_hwidth *= img_wheight *= img_hx_min = int(x_center - width / 2)y_min = int(y_center - height / 2)x_max = int(x_center + width / 2)y_max = int(y_center + height / 2)# 绘制边界框(绿色框,线宽2像素)cv2.rectangle(image, (x_min, y_min), (x_max, y_max), (0, 255, 0), 2)# 仅显示类别数值(class_id)cv2.putText(image, f"{int(class_id)}",(x_min, y_min - 10),cv2.FONT_HERSHEY_SIMPLEX, 0.5, (0, 255, 0), 2)# 显示结果
plt.figure(figsize=(12, 8))
plt.imshow(image)
plt.axis('off')
plt.title(f"Image: {target_image_name} (Class IDs only)")
plt.show()