Oceanbase单机版上手示例
本月初Oceanbase单机版发布,作为一个以分布式起家的数据库,原来一个集群动辄小十台机器,多着十几台几十台甚至更多,Oceanbase单机版的发布确实大大降低了硬件部署的门槛。
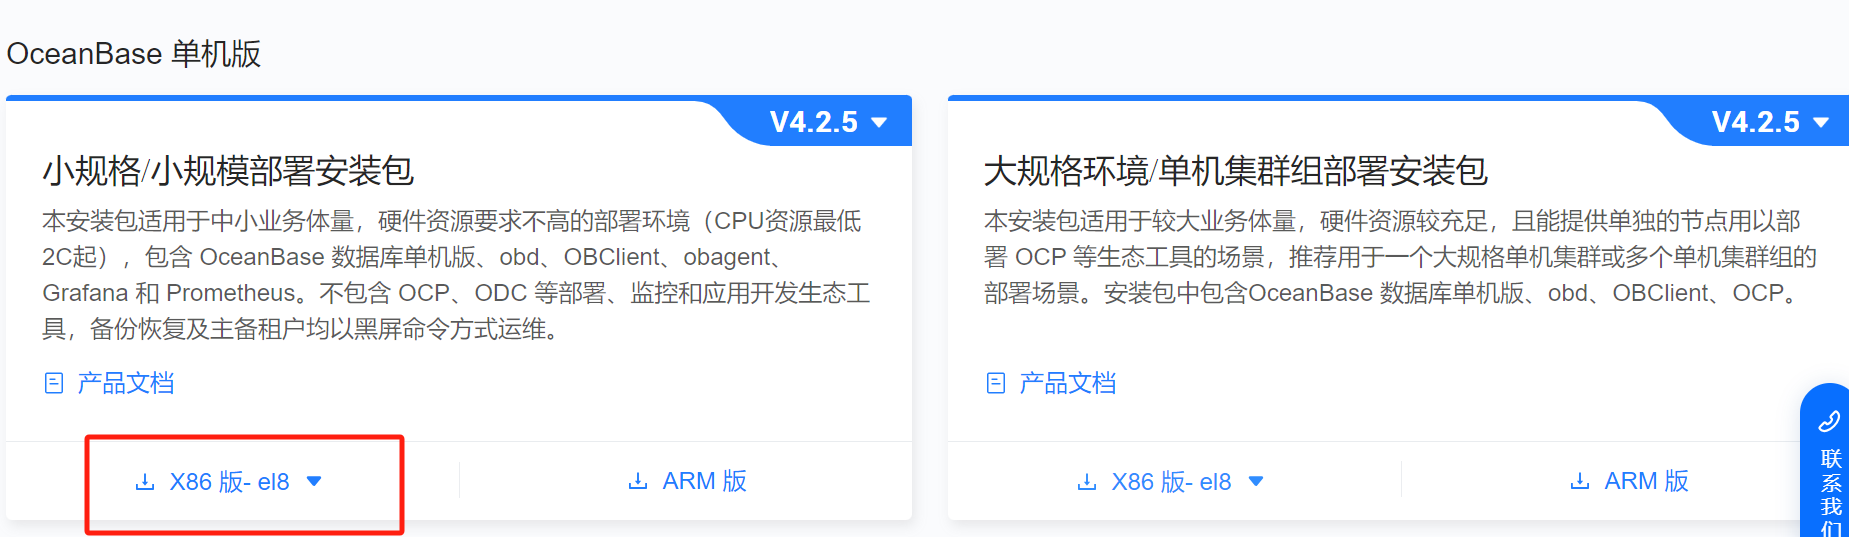
1.下载安装介质
https://www.oceanbase.com/softwarecenter-standalone
这里选择小规模部署,Linux8版本,大小700多M
oceanbase-standalone-all-in-one-4.2.5.3-103000152025033110.el8.x86_64.tar.gz
2.安装环境
本次测试使用的环境为Redhat8.5 4C 16GB 虚机,官方的配置要求如下:
| 项目 | 描述 |
|---|---|
| 系统 |
|
| CPU | 最低要求 2 核,推荐 4 核及以上。 |
| 内存 | 最低要求 6 GB,推荐设置在 16 GB 至 1024 GB 范围内。 |
| 磁盘类型 | 使用 SSD 存储。 |
| 磁盘存储空间 | 最低要求 20 GB。 |
| 文件系统 | EXT4 或 XFS,当数据超过 16 TB 时,使用 XFS。 |
| all-in-one 安装包 | 单机版 all-in-one 安装包。 |
3.组件介绍
-
obd
OceanBase Deployer,OceanBase 安装部署工具,简称为 obd。详细信息请参考官网文档 OceanBase 安装部署工具。
-
OBAgent
OBAgent 是 OceanBase 数据库监控采集框架,支持推、拉两种数据采集模式,可以满足不同的应用场景。
-
Grafana
Grafana 是一款开源的数据可视化工具,它可以将数据源中的各种指标数据进行可视化展示,以便更直观地了解系统运行状态和性能指标。详细信息可参见 Grafana 官网。
-
Prometheus
Prometheus 是一个开源的服务监控系统和时序数据库,其提供了通用的数据模型以及快捷数据采集、存储和查询接口。详细信息可参见 Prometheus 官网。
4.快速部署单机版
4.1解压安装包
[root@SZSPLORACLE01T ~]# tar -xzf oceanbase-standalone-all-in-one-4.2.5.3-103000152025033110.el8.x86_64.tar.gz
[root@SZSPLORACLE01T ~]# ll
total 741860
-rw-------. 1 root root      1544 May  7  2024 anaconda-ks.cfg
-rw-r--r--. 1 root root      1992 May  8  2024 initial-setup-ks.cfg
drwxr-xr-x. 6 root root        88 Apr  2 16:28 oceanbase-standalone-all-in-one
-rw-r--r--. 1 root root 759655350 Apr 17 09:20 oceanbase-standalone-all-in-one-4.2.5.3-103000152025033110.el8.x86_64.tar.gz
[root@SZSPLORACLE01T ~]# cd oceanbase-standalone-all-in-one/bin
[root@SZSPLORACLE01T bin]#
[root@SZSPLORACLE01T bin]# ll
total 52
-rwxr-xr-x. 1 root root   281 Apr  2 16:27 env.sh
-rwxr-xr-x. 1 root root  5336 Apr  2 16:27 install_obd.sh
-rwxr-xr-x. 1 root root 35170 Apr  2 16:27 install_ob.sh
-rwxr-xr-x. 1 root root  2058 Apr  2 16:27 uninstall_obd.sh
4.2系统参数配资
系统资源限制
cat >>/etc/security/limits.conf <<EOF
* soft nofile 655350
* hard nofile 655350
* soft stack unlimited
* hard stack unlimited
* soft nproc 655360
* hard nproc 655360
* soft core unlimited
* hard core unlimited
EOF
cat <> /etc/sysctl.conf kernel.sem = 4096 4194304 32768 1024 fs.aio-max-nr = 1048576 fs.file-max = 6573688 vm.max_map_count=655360 EOF[root@SZSPLORACLE01T ~]# sysctl -p kernel.sem = 4096 4194304 32768 1024 fs.aio-max-nr = 1048576 fs.file-max = 6573688 vm.max_map_count = 655360
创建oceanbase数据和日志目录,理论上ob建议data和log不要放在同一个物理磁盘
如果放在同一个物理磁盘会有个告警提示
mkdir -p /data/ob/data
mkdir -p /data/ob/clog
4.3安装OBD
[root@SZSPLORACLE01T bin]# ./install_obd.sh
install obd as root
No previous obd installed, try install..., wait a moment
name: grafana
version: 7.5.17
release:1
arch: x86_64
md5: 1bf1f338d3a3445d8599dc6902e7aeed4de4e0d6
size: 177766248
add /root/oceanbase-standalone-all-in-one/rpms/grafana-7.5.17-1.el8.x86_64.rpm to local mirror
name: obagent
version: 4.2.2
release:100000042024011120.el8
arch: x86_64
md5: bf152b880953c2043ddaf80d6180cf22bb8c8ac2
size: 72919140
add /root/oceanbase-standalone-all-in-one/rpms/obagent-4.2.2-100000042024011120.el8.x86_64.rpm to local mirror
name: ob-deploy
version: 3.2.0
release:2.el8
arch: x86_64
md5: 529076c3e548f690ea6cb4e50cd77b2dfc4bfc6d
size: 178634999
add /root/oceanbase-standalone-all-in-one/rpms/ob-deploy-3.2.0-2.el8.x86_64.rpm to local mirror
name: oceanbase-diagnostic-tool
version: 3.2.0
release:52025031411.el8
arch: x86_64
md5: e7aeaa17222aa079c8d9e0c74a73e1d7f9c5501b
size: 71147006
add /root/oceanbase-standalone-all-in-one/rpms/oceanbase-diagnostic-tool-3.2.0-52025031411.el8.x86_64.rpm to local mirror
name: oceanbase-standalone
version: 4.2.5.3
release:103000152025033110.el8
arch: x86_64
md5: 305669b55281773f5c53ff4e44ff9f7bed9f7bc0
size: 1813828757
add /root/oceanbase-standalone-all-in-one/rpms/oceanbase-standalone-4.2.5.3-103000152025033110.el8.x86_64.rpm to local mirror
name: oceanbase-standalone-libs
version: 4.2.5.3
release:103000152025033110.el8
arch: x86_64
md5: 84315910ce45d91ed361867215964369044185c0
size: 7848
add /root/oceanbase-standalone-all-in-one/rpms/oceanbase-standalone-libs-4.2.5.3-103000152025033110.el8.x86_64.rpm to local mirror
name: prometheus
version: 2.37.1
release:10000102022110211.el8
arch: x86_64
md5: e4f8a3e784512fca75bf1b3464247d1f31542cb9
size: 211224073
add /root/oceanbase-standalone-all-in-one/rpms/prometheus-2.37.1-10000102022110211.el8.x86_64.rpm to local mirror
Trace ID: c1065028-1b58-11f0-8e69-0050568fd99f
If you want to view detailed obd logs, please run: obd display-trace c1065028-1b58-11f0-8e69-0050568fd99f
Disable remote ok
Trace ID: c2d4905e-1b58-11f0-b490-0050568fd99f
If you want to view detailed obd logs, please run: obd display-trace c2d4905e-1b58-11f0-b490-0050568fd99fadd auto set env logic to profile: /root/.bash_profileExecute this command to apply the environment config:`source ~/.oceanbase-all-in-one/bin/env.sh `
[root@SZSPLORACLE01T bin]# source ~/.oceanbase-all-in-one/bin/env.sh
4.4用 obd demo 命令部署单机版
-
仅部署 OceanBase 数据库
obd demo -c oceanbase-standalone -
部署带有 OBAgent、Prometheus 和 Grafana 组件的 OceanBase 数据库
obd demo -c oceanbase-standalone,obagent,grafana,prometheus
- 我这里选择的是部署全部的
[root@SZSPLORACLE01T bin]# obd demo -c oceanbase-standalone,obagent,grafana,prometheus
Package grafana-7.5.17-1 is available.
Package oceanbase-standalone-4.2.5.3-103000152025033110.el8 is available.
Package prometheus-2.37.1-10000102022110211.el8 is available.
Package obagent-4.2.2-100000042024011120.el8 is available.
install grafana-7.5.17 for local ok
install oceanbase-standalone-4.2.5.3 for local ok
install prometheus-2.37.1 for local ok
install obagent-4.2.2 for local ok
Cluster param config check ok
Open ssh connection ok
Generate grafana configuration ok
Generate prometheus configuration ok
Generate obagent configuration ok
+----------------------------------------------------------------------------------------------------+
|                                              Packages                                              |
+----------------------+---------+------------------------+------------------------------------------+
| Repository           | Version | Release                | Md5                                      |
+----------------------+---------+------------------------+------------------------------------------+
| grafana              | 7.5.17  | 1                      | 1bf1f338d3a3445d8599dc6902e7aeed4de4e0d6 |
| oceanbase-standalone | 4.2.5.3 | 103000152025033110.el8 | 305669b55281773f5c53ff4e44ff9f7bed9f7bc0 |
| prometheus           | 2.37.1  | 10000102022110211.el8  | e4f8a3e784512fca75bf1b3464247d1f31542cb9 |
| obagent              | 4.2.2   | 100000042024011120.el8 | bf152b880953c2043ddaf80d6180cf22bb8c8ac2 |
+----------------------+---------+------------------------+------------------------------------------+
Repository integrity check ok
Load param plugin ok
Open ssh connection ok
Initializes obagent work home ok
Initializes observer work home ok
Initializes prometheus work home ok
Initializes grafana work home ok
Parameter check ok
Remote grafana-7.5.17-1-1bf1f338d3a3445d8599dc6902e7aeed4de4e0d6 repository install ok
Remote grafana-7.5.17-1-1bf1f338d3a3445d8599dc6902e7aeed4de4e0d6 repository lib check ok
Remote oceanbase-standalone-4.2.5.3-103000152025033110.el8-305669b55281773f5c53ff4e44ff9f7bed9f7bc0 repository install ok
Remote oceanbase-standalone-4.2.5.3-103000152025033110.el8-305669b55281773f5c53ff4e44ff9f7bed9f7bc0 repository lib check ok
Remote prometheus-2.37.1-10000102022110211.el8-e4f8a3e784512fca75bf1b3464247d1f31542cb9 repository install ok
Remote prometheus-2.37.1-10000102022110211.el8-e4f8a3e784512fca75bf1b3464247d1f31542cb9 repository lib check ok
Remote obagent-4.2.2-100000042024011120.el8-bf152b880953c2043ddaf80d6180cf22bb8c8ac2 repository install ok
Remote obagent-4.2.2-100000042024011120.el8-bf152b880953c2043ddaf80d6180cf22bb8c8ac2 repository lib check ok
demo deployed
Get local repositories ok
Load cluster param plugin ok
Open ssh connection ok
[ERROR] OBD-1007: (127.0.0.1) The value of the ulimit parameter "open files" must not be less than 20000 (Current value: 1024), Please execute `echo -e "* soft nofile 20000\n* hard nofile 20000" >> /etc/security/limits.d/nofile.conf` as root in 127.0.0.1. if it dosen't work, please check whether UsePAM is yes in /etc/ssh/sshd_config.
[WARN] OBD-1007: (127.0.0.1) The recommended number of core file size is unlimited (Current value: 0)
[WARN] OBD-1007: (127.0.0.1) The recommended number of stack size is unlimited (Current value: 8192)
[WARN] OBD-1017: (127.0.0.1) The value of the "vm.max_map_count" must be within [327600, 1310720] (Current value: 65530, Recommended value: 655360)
[WARN] OBD-2000: (127.0.0.1) not enough memory. (Free: 2G, Need: 6G)
[WARN] OBD-1012: (127.0.0.1) clog and data use the same disk (/)
You can use the `obd cluster init4env demo` command to automatically configure system parameters
See https://www.oceanbase.com/product/ob-deployer/error-codes .
Trace ID: 750e2b0e-1b59-11f0-a24f-0050568fd99f
If you want to view detailed obd logs, please run: obd display-trace 750e2b0e-1b59-11f0-a24f-0050568fd99f##报错是因为没有修改系统open file限制,报错清晰提示了 解决办法 还是比较人性化的
[root@SZSPLORACLE01T bin]# echo -e "* soft nofile 20000\n* hard nofile 20000" >> /etc/security/limits.d/nofile.conf
#这个参数需要退出重新登陆生效 ulimit -n 确认
[root@SZSPLORACLE01T bin]# obd cluster init4env demo  ##初始化参数
Get local repositories ok
Open ssh connection ok
get system config ok
+---------------------------------------------+
|         System Parameter Change List        |
+-----------+------------------+--------------+
| ip        | need_change_var  | target_value |
+-----------+------------------+--------------+
| 127.0.0.1 | nofile           | 655350       |
| 127.0.0.1 | vm.max_map_count | 655360       |
+-----------+------------------+--------------+
Are you sure to change the parameters listed above ? [y/n]: y
127.0.0.1: ( nofile,vm.max_map_count ) have been successfully modified!
Trace ID: 34775ee8-1b5a-11f0-867b-0050568fd99f
If you want to view detailed obd logs, please run: obd display-trace 34775ee8-1b5a-11f0-867b-0050568fd99f
[root@SZSPLORACLE01T bin]#
数据库的默认密码 还有其他的一些配置信息和初始密码 需要在/root/.obd/cluster/demo/config.yaml 配置文件中找到
[root@SZSPLORACLE01T bin]# cat /root/.obd/cluster/demo/config.yaml
grafana:servers:- 127.0.0.1global:home_path: /root/grafanalogin_password: rutKOUCCQddepends:- prometheus
oceanbase-standalone:servers:- 127.0.0.1global:home_path: /root/oceanbase-standaloneappname: democluster_id: 1744873372enable_syslog_wf: falsemax_syslog_file_count: 16production_mode: falsememory_limit: 6G__min_full_resource_pool_memory: 1073741824system_memory: 1Gcpu_count: 8datafile_size: 2Gdatafile_maxsize: 8Gdatafile_next: 2Glog_disk_size: 14Groot_password: DuOqczoc33uwqjwouZbMocp_agent_monitor_password: h5hja8xpdU
prometheus:servers:- 127.0.0.1global:home_path: /root/prometheusdepends:- obagent
obagent:servers:- 127.0.0.1global:home_path: /root/obagentob_monitor_status: activedepends:- oceanbase-standalones
4.5使用install_ob.sh交互部署
好处就是密码和安装路径等配置可以手动配置,如下是输出
这里有点不错的是 需要用户注意的部门参数 会被高亮提示
[root@SZSPLORACLE01T bin]# ./install_ob.sh
Enter the IP (Default: 10.253.32.120) (only support local IP):Valid local IP: 10.253.32.120
Enter the current user password :
Trace ID: 4214918c-1b6a-11f0-a741-0050568fd99f
If you want to view detailed obd logs, please run: obd display-trace 4214918c-1b6a-11f0-a741-0050568fd99f
get system config ok
No need to change system parameters
Trace ID: 43441fdc-1b6a-11f0-9023-0050568fd99f
If you want to view detailed obd logs, please run: obd display-trace 43441fdc-1b6a-11f0-9023-0050568fd99fEnter the cluster name (Default: standalone; allowed characters: letters, numbers, and underscores): norton
Enter the OB SQL port (Default: 2881):
Enter the OB RPC port (Default: 2882):
Enter the obshell port (Default: 2886):
Enter the OB root password (Default: abQ6VRGDPA6jh8cZl41O):
Confirm the OB root password:
Enter the OB cpu count (Default: 4):The cpu_count cannot be less than 8. It will be set to 8 automatically.
Enter the OB memory limit (Configurable Range[6, 10], Default: 10, Unit: G): 6
Enter the OB installation directory (Default: /root/norton):
Enter the OB data directory (Default: /data/1/norton): /data/ob/norton
Enter the OB log directory (Default: /data/log1/norton): /oblogThe data_dir and redo_dir are using the same disk.
Enter the OB datafile maxsize (Configurable Range[12, 39], Default: 39, Unit: G):
Enter the OB log disk size (Configurable Range[12, 16], Default: 16, Unit: G):Do you want to create tenant for your business workload? (y/n)(Default: y):  n
OceanBase Database will not be create tenant.Do you want to enable encryption for password security? (y/n) (Default: n):Do you need to install the monitoring components (OBAgent, Prometheus, Grafana)? (y/n) (Default: y):  y
Enter the OBAgent monitoring service port (Default: 8088):
Enter the OBAgent management service port (Default: 8089):
Enter the Prometheus port (Default: 9090):
Enter the Grafana port (Default: 3000):#Saved configurations:cluster name: nortonmysql port: 2881rpc port: 2882obshell port: 2886cpu count: 8memory limit: 6Ghome path: /root/nortondata dir: /data/ob/nortonlog dir: /oblogdatafile maxsize: 39Glog disk size: 16GOBAgent monitoring service port: 8088OBAgent management service port: 8089Prometheus port: 9090Grafana port: 3000Are you sure these configurations are correct? (y/n) (Default: y):
Configuration confirmed.start cluster...
Cluster param config check ok
Open ssh connection ok
Generate obagent configuration ok
Generate prometheus configuration ok
Generate grafana configuration ok
+----------------------------------------------------------------------------------------------------+
|                                              Packages                                              |
+----------------------+---------+------------------------+------------------------------------------+
| Repository           | Version | Release                | Md5                                      |
+----------------------+---------+------------------------+------------------------------------------+
| oceanbase-standalone | 4.2.5.3 | 103000152025033110.el8 | 305669b55281773f5c53ff4e44ff9f7bed9f7bc0 |
| obagent              | 4.2.2   | 100000042024011120.el8 | bf152b880953c2043ddaf80d6180cf22bb8c8ac2 |
| prometheus           | 2.37.1  | 10000102022110211.el8  | e4f8a3e784512fca75bf1b3464247d1f31542cb9 |
| grafana              | 7.5.17  | 1                      | 1bf1f338d3a3445d8599dc6902e7aeed4de4e0d6 |
+----------------------+---------+------------------------+------------------------------------------+
Repository integrity check ok
Load param plugin ok
Open ssh connection ok
Initializes obagent work home ok
Initializes observer work home ok
Initializes prometheus work home ok
Initializes grafana work home ok
Parameter check ok
Remote oceanbase-standalone-4.2.5.3-103000152025033110.el8-305669b55281773f5c53ff4e44ff9f7bed9f7bc0 repository install ok
Remote oceanbase-standalone-4.2.5.3-103000152025033110.el8-305669b55281773f5c53ff4e44ff9f7bed9f7bc0 repository lib check ok
Remote obagent-4.2.2-100000042024011120.el8-bf152b880953c2043ddaf80d6180cf22bb8c8ac2 repository install ok
Remote obagent-4.2.2-100000042024011120.el8-bf152b880953c2043ddaf80d6180cf22bb8c8ac2 repository lib check ok
Remote prometheus-2.37.1-10000102022110211.el8-e4f8a3e784512fca75bf1b3464247d1f31542cb9 repository install ok
Remote prometheus-2.37.1-10000102022110211.el8-e4f8a3e784512fca75bf1b3464247d1f31542cb9 repository lib check ok
Remote grafana-7.5.17-1-1bf1f338d3a3445d8599dc6902e7aeed4de4e0d6 repository install ok
Remote grafana-7.5.17-1-1bf1f338d3a3445d8599dc6902e7aeed4de4e0d6 repository lib check ok
norton deployed
Get local repositories ok
Load cluster param plugin ok
Open ssh connection ok
[WARN] OBD-1012: (10.253.32.120) clog and data use the same disk (/)
Check before start obagent ok
Check before start prometheus ok
Check before start grafana ok
cluster scenario: None
Start observer ok
observer program health check x
[WARN] OBD-2002: Failed to start 10.253.32.120 observer
See https://www.oceanbase.com/product/ob-deployer/error-codes .
Trace ID: 7e8dffc2-1b6a-11f0-b076-0050568fd99f
If you want to view detailed obd logs, please run: obd display-trace 7e8dffc2-1b6a-11f0-b076-0050568fd99f
4.6排错
这里一直提示部署报错 ,提示系统observer启动失败,集群状态失败
可以用上面的命令查看install log 确认报错的问题,可以看到直接启动失败 health check失败
obd display-trace 7e8dffc2-1b6a-11f0-b076-0050568fd99f[2025-04-18 09:55:05.178] [WARNING] OBD-2002: Failed to start 10.253.32.120 observer
[2025-04-18 09:55:05.179] [DEBUG] - plugin oceanbase-standalone-py_script_health_check-3.1.0 result: False
检查系统启动日志/root/norton/oceanbase/log/observer.log 关键信息如下
[root@SZSPLORACLE02T bin]# cat /root/norton/oceanbase/log/observer.log|more
[2025-04-18 09:55:01.974369] EDIAG [SERVER] init (...) [errcode=-4007] unsupported CPU platform, AVX instructions are required.
...
[2025-04-18 09:55:01.974707] EDIAG [SERVER] init (...) [ret="OB_NOT_SUPPORTED"]
当前主机不支持 AVX 指令集,OceanBase 无法运行
OceanBase 从 4.x 版本开始,要求 CPU 必须支持 AVX(Advanced Vector Extensions) 指令集,这是启动失败的直接原因。
因为我这台测试机跑在的物理机是是一套很老的HP刀片(超过10年)cpu太老不支持AVX,理论上稍微新一点的机器都会支持的,不存在这个问题
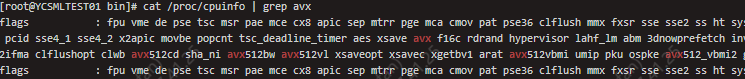
检查我的虚拟机的 CPU 是否支持 AVX 指令:
执行以下命令检查:
[root@SZSPLORACLE02T bin]# cat /proc/cpuinfo | grep avx
-
有输出:表示支持
-
无输出:当前机器 CPU 不支持 AVX,无法运行 OceanBase 4.x
好吧我这台虚拟机无法安装,折腾了大半天 结果我的虚机不支持吐血。
4.7 换机器重新安装
我重新换了台测试机,首先确认CPU 是否支持AVX,确认支持后,按前面的安装步骤非常顺利的完成
安装完成后 obclient -h10.247.41.25 -P2881 -uSYS@test 登陆到数据库
因为我这里选择的oracle 兼容,看到可以查询dual虚表。
[root@TEST01 bin]# obclient -h10.247.41.25 -P2881 -uSYS@test Welcome to the OceanBase. Commands end with ; or \g. Your OceanBase connection id is 3221526087 Server version: OceanBase 4.2.5.3 (r103000152025033110-f5b88cd987f23383677f2eb53cf76ed38a48979b) (Built Mar 31 2025 11:08:20)Copyright (c) 2000, 2018, OceanBase and/or its affiliates. All rights reserved.Type 'help;' or '\h' for help. Type '\c' to clear the current input statement.obclient(SYS@test)[SYS]> obclient(SYS@test)[SYS]> select * from dual; +-------+ | DUMMY | +-------+ | X | +-------+ 1 row in set (0.001 sec)obclient(SYS@test)[SYS]>obclient(SYS@test)[SYS]> select * from v$version; +---------------------------------------------------------------------------------------------------------------+--------+ | BANNER | CON_ID | +---------------------------------------------------------------------------------------------------------------+--------+ | OceanBase 4.2.5.3 (r103000152025033110-f5b88cd987f23383677f2eb53cf76ed38a48979b) (Built Mar 31 2025 11:08:20) | 0 | +---------------------------------------------------------------------------------------------------------------+--------+
5.OceanBase 集群常用命令
删除当前集群
obd cluster destroy norton检查observer的状态
ps -ef | grep observer
若没有 observer 进程,说明 OceanBase 没有运行。
可使用 OBD 启动:
obd cluster start demo
或者先检查状态:
 obd cluster start demo
Get local repositories ok
Load cluster param plugin ok
Cluster status check ok
Deploy "demo" is running
Trace ID: ba82bdec-1c14-11f0-9e09-0050568abb63
If you want to view detailed obd logs, please run: obd display-trace ba82bdec-1c14-11f0-9e09-0050568abb63
[root@YCSMLTEST01 bin]# obd cluster display demo
Get local repositories and plugins ok
Open ssh connection ok
Connect to observer 10.247.41.25:2881 ok
Wait for observer init ok
+------------------------------------------------+
|              oceanbase-standalone              |
+--------------+---------+------+-------+--------+
| ip           | version | port | zone  | status |
+--------------+---------+------+-------+--------+
| 10.247.41.25 | 4.2.5.3 | 2881 | zone1 | ACTIVE |
+--------------+---------+------+-------+--------+
obclient -h10.247.41.25 -P2881 -uroot@sys -p'norton' -Doceanbase -Acluster unique id: c017ba54-fd3e-5512-bfec-707afd0d8eeb-196474f3b47-03050204Connect to Obagent ok
+-----------------------------------------------------------------+
|                             obagent                             |
+--------------+--------------------+--------------------+--------+
| ip           | mgragent_http_port | monagent_http_port | status |
+--------------+--------------------+--------------------+--------+
| 10.247.41.25 | 8089               | 8088               | active |
+--------------+--------------------+--------------------+--------+
Connect to Prometheus ok
+--------------------------------------------------------+
|                       prometheus                       |
+--------------------------+-------+------------+--------+
| url                      | user  | password   | status |
+--------------------------+-------+------------+--------+
| http://10.247.41.25:9090 | admin | 0YdjBC1EFw | active |
+--------------------------+-------+------------+--------+
Connect to grafana ok
+-------------------------------------------------------------------+
|                              grafana                              |
+--------------------------------------+-------+-----------+--------+
| url                                  | user  | password  | status |
+--------------------------------------+-------+-----------+--------+
| http://10.247.41.25:3000/d/oceanbase | admin | oceanbase | active |
+--------------------------------------+-------+-----------+--------+
Trace ID: c6a33eda-1c14-11f0-b8d7-0050568abb63
If you want to view detailed obd logs, please run: obd display-trace c6a33eda-1c14-11f0-b8d7-0050568abb63