Valgrind内存调试工具详解
介绍
Valgrind是C++开发者必备的调试神器,尤其擅长解决内存问题。无论是新手还是资深工程师,学会使用Valgrind都能大幅提升代码质量。
Valgrind是Linux环境下最强大的动态分析工具之一,主要用于检测 内存泄漏、越界访问、未初始化变量、线程竞争 等C/C++程序中的常见问题。它通过虚拟执行程序(类似“沙盒”)来监控内存和线程行为,无需修改源码即可发现问题。
核心功能(C++ 相关):
Memcheck(默认工具):检测内存错误(泄漏、非法访问等)。
Callgrind:性能分析,生成函数调用图。
Helgrind:检测多线程竞争和死锁。
Massif:堆内存分析,可视化内存占用趋势。
安装
在 Linux 下安装(Ubuntu/Debian):
sudo apt-get install valgrind基本使用
基础检测
假设我们有一个 C++ 程序 example.cpp,编译后生成可执行文件 example:
#include <iostream>
#include <cstdlib>int main() {int* arr = new int[10];  // 动态分配内存arr[10] = 42;            // 越界访问(Bug!)// delete[] arr;         // 故意不释放内存(内存泄漏!)return 0;
}
编译并运行 Valgrind 检测:
g++ -g example.cpp -o example  # -g 保留调试信息
valgrind --leak-check=full ./example
解读输出
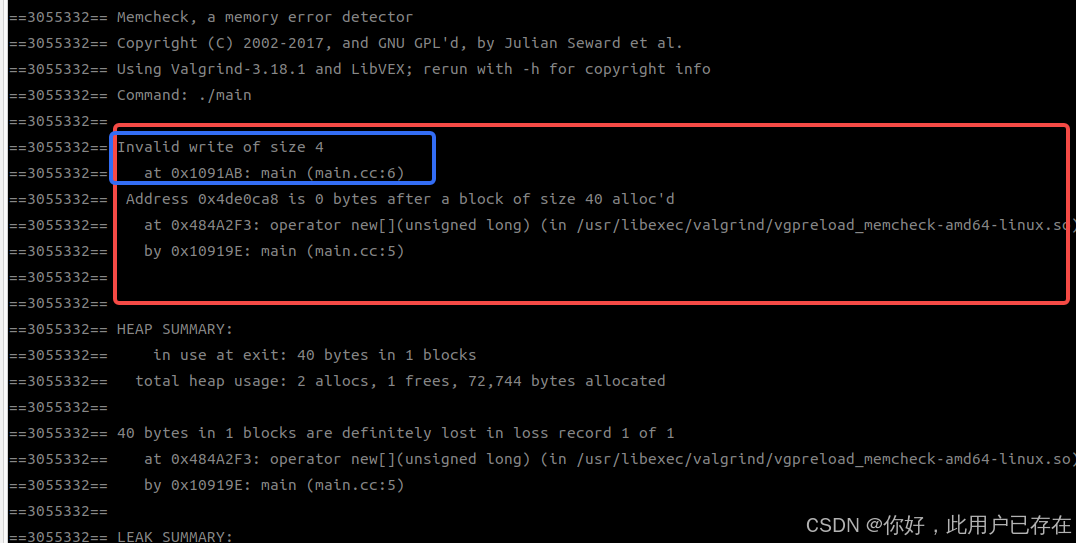
Valgrind 会报告:
-
越界访问(
Invalid write of size 4)。 -
内存泄漏(
definitely lost: 40 bytes)。
示例输出:
==3055332== Memcheck, a memory error detector
==3055332== Copyright (C) 2002-2017, and GNU GPL'd, by Julian Seward et al.
==3055332== Using Valgrind-3.18.1 and LibVEX; rerun with -h for copyright info
==3055332== Command: ./main
==3055332==
==3055332== Invalid write of size 4
==3055332==    at 0x1091AB: main (main.cc:6)
==3055332==  Address 0x4de0ca8 is 0 bytes after a block of size 40 alloc'd
==3055332==    at 0x484A2F3: operator new[](unsigned long) (in /usr/libexec/valgrind/vgpreload_memcheck-amd64-linux.so)
==3055332==    by 0x10919E: main (main.cc:5)
==3055332==
==3055332==
==3055332== HEAP SUMMARY:
==3055332==     in use at exit: 40 bytes in 1 blocks
==3055332==   total heap usage: 2 allocs, 1 frees, 72,744 bytes allocated
==3055332==
==3055332== 40 bytes in 1 blocks are definitely lost in loss record 1 of 1
==3055332==    at 0x484A2F3: operator new[](unsigned long) (in /usr/libexec/valgrind/vgpreload_memcheck-amd64-linux.so)
==3055332==    by 0x10919E: main (main.cc:5)
==3055332==
==3055332== LEAK SUMMARY:
==3055332==    definitely lost: 40 bytes in 1 blocks
==3055332==    indirectly lost: 0 bytes in 0 blocks
==3055332==      possibly lost: 0 bytes in 0 blocks
==3055332==    still reachable: 0 bytes in 0 blocks
==3055332==         suppressed: 0 bytes in 0 blocks
==3055332==
==3055332== For lists of detected and suppressed errors, rerun with: -s
==3055332== ERROR SUMMARY: 2 errors from 2 contexts (suppressed: 0 from 0)
可以看到,Valgrind可以直接定位到出现问题的代码位置:
进阶使用:不同工具实战
1)Memcheck:内存错误检测
Valgrind 默认使用 Memcheck,适用于检测:
-
使用未初始化的变量
-
非法读写(越界、释放后访问)
-
内存泄漏(
--leak-check=full显示详细泄漏点)
2)Callgrind:性能分析
生成函数调用图,定位性能瓶颈:
valgrind --tool=callgrind ./example使用 kcachegrind 可视化分析:
kcachegrind callgrind.out.3063182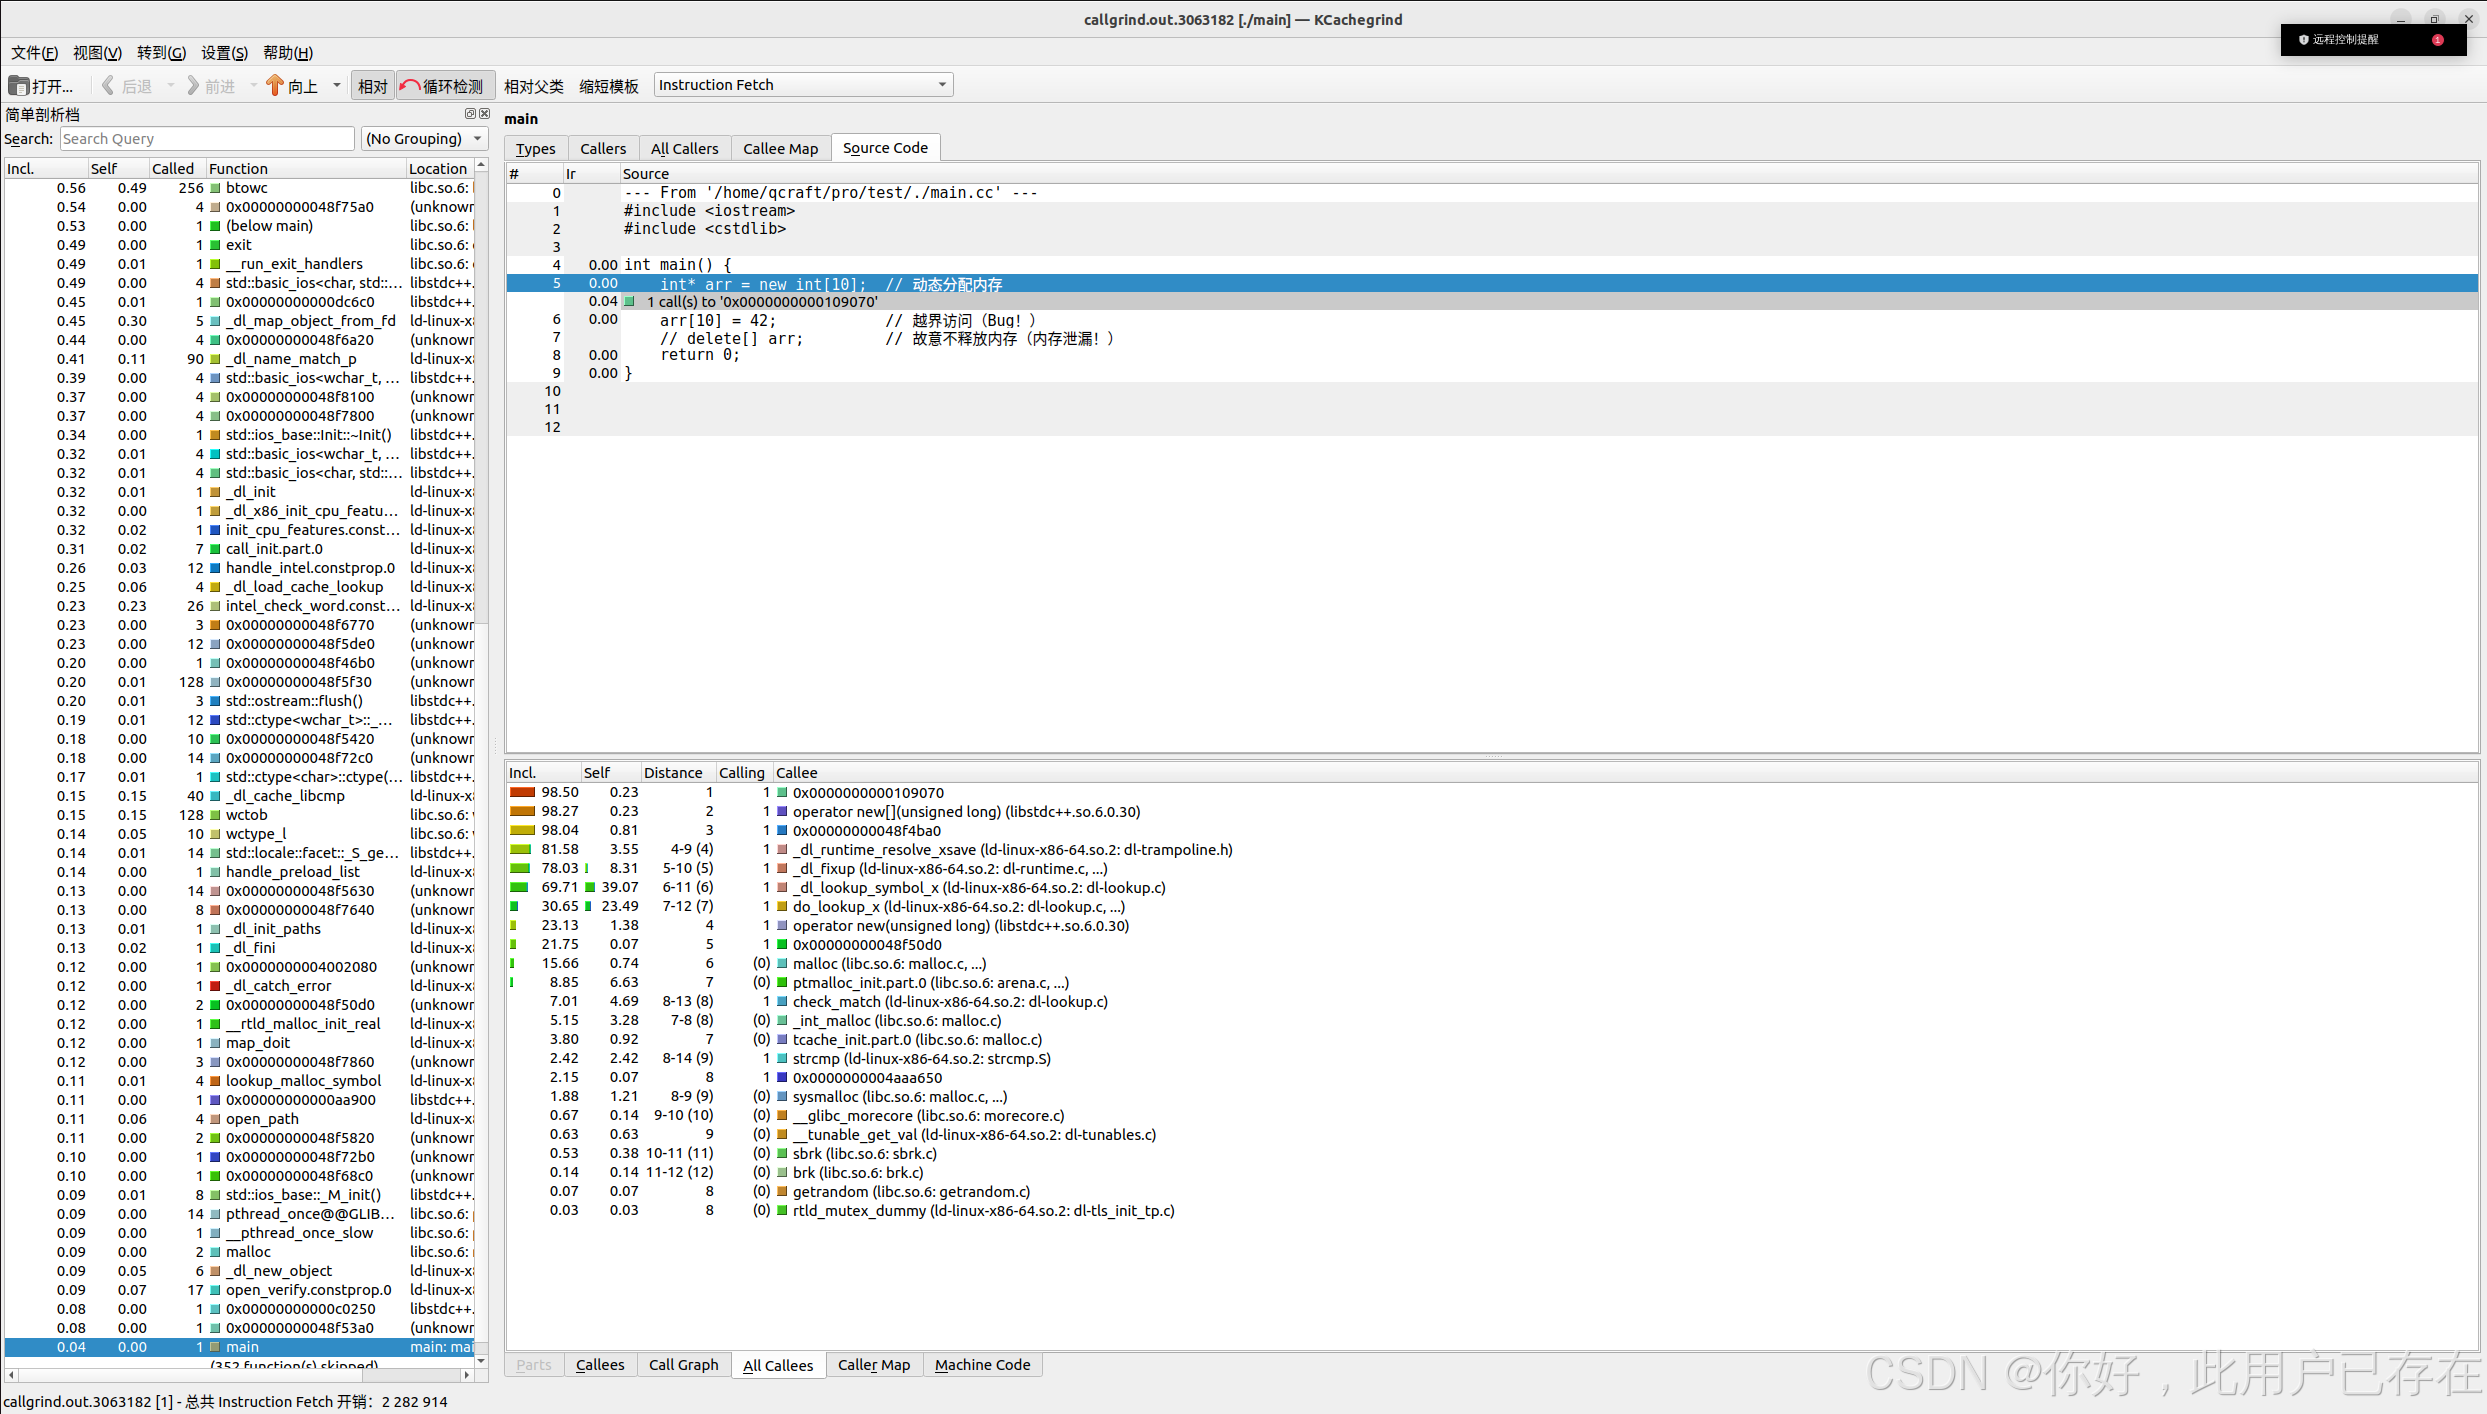
3)Helgrind:多线程竞争检测
检测线程同步问题(如未加锁的共享数据访问):
#include <thread>
#include <vector>std::vector<int> shared_data;void worker() {for (int i = 0; i < 1000; ++i) {shared_data.push_back(i);  // 线程竞争!}
}int main() {std::thread t1(worker);std::thread t2(worker);t1.join();t2.join();return 0;
}
运行检测:
valgrind --tool=helgrind ./thread_example Helgrind 会报告数据竞争(Possible data race)。
==3329455== Possible data race during write of size 8 at 0x10E040 by thread #3
==3329455== Locks held: none
==3329455==    at 0x109A6A: void std::vector<int, std::allocator<int> >::_M_realloc_insert<int const&>(__gnu_cxx::__normal_iterator<int*, std::vector<int, std::allocator<int> > >, int const&) (vector.tcc:504)
==3329455==    by 0x1096B3: std::vector<int, std::allocator<int> >::push_back(int const&) (stl_vector.h:1198)
==3329455==    by 0x109302: worker() (main.cc:8)
==3329455==    by 0x10A760: void std::__invoke_impl<void, void (*)()>(std::__invoke_other, void (*&&)()) (invoke.h:61)
==3329455==    by 0x10A70C: std::__invoke_result<void (*)()>::type std::__invoke<void (*)()>(void (*&&)()) (invoke.h:96)
==3329455==    by 0x10A6AD: void std::thread::_Invoker<std::tuple<void (*)()> >::_M_invoke<0ul>(std::_Index_tuple<0ul>) (std_thread.h:259)
==3329455==    by 0x10A67D: std::thread::_Invoker<std::tuple<void (*)()> >::operator()() (std_thread.h:266)
==3329455==    by 0x10A615: std::thread::_State_impl<std::thread::_Invoker<std::tuple<void (*)()> > >::_M_run() (std_thread.h:211)
==3329455==    by 0x4952252: ??? (in /usr/lib/x86_64-linux-gnu/libstdc++.so.6.0.30)
==3329455==    by 0x485396A: ??? (in /usr/libexec/valgrind/vgpreload_helgrind-amd64-linux.so)
==3329455==    by 0x4B56AC2: start_thread (pthread_create.c:442)
==3329455==    by 0x4BE7A03: clone (clone.S:100)
适用场景
开发阶段:快速定位内存错误,避免线上崩溃。
性能优化:分析热点函数,优化关键路径。
多线程调试:发现竞争条件和死锁。
注意事项
-
运行速度较慢:Valgrind 会使程序执行速度下降 10-50 倍,仅用于调试。
-
仅支持 Linux:Windows/macOS 需使用 WSL 或 Docker。
-
编译时加
-g:确保输出包含源码行号。