【Matlab】中国沿岸潮滩宽度和坡度分布
【Matlab】中国沿岸潮滩宽度和坡度分布
参考文献见最后或者阅读原文!
中国沿岸潮滩宽度和坡度分布:
figure 1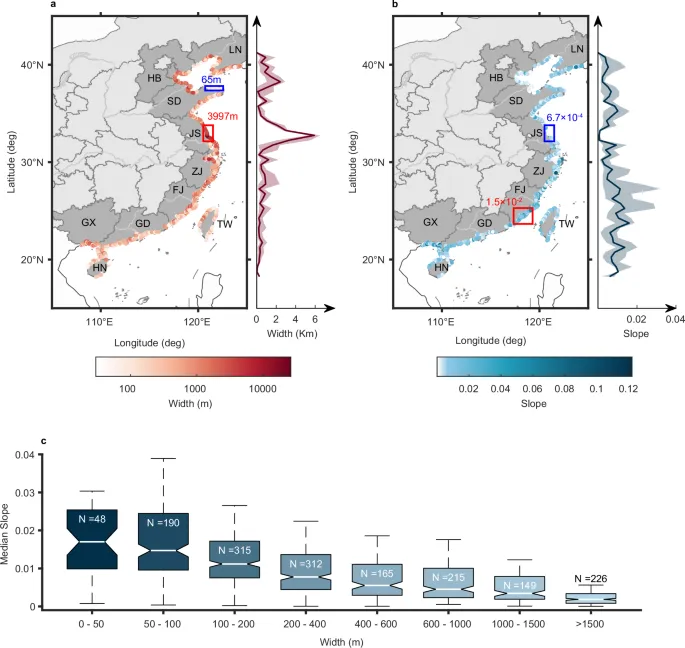
a 潮滩宽度分布。b 潮滩坡度分布。
图中标注了中国沿海各省,分别为辽宁(LN)、河北(HB)、山东(SD)、江苏(JS)、浙江(ZJ)、福建(FJ)、广东(GD)、广西(GX)、海南(HN)和台湾(TW)。
地图上的红色框表示宽度或坡度较大的区域,蓝色框表示数值最小的区域。图中的数值代表框内数据的中位数。潮滩宽度和坡度随纬度的变化展示在右侧面板中,阴影区域表示第 25 和第 75 百分位之间的范围。
c 各组中潮滩宽度与中位坡度之间的关系。
N 表示数据点数量。箱线图的上须延伸至第 75 百分位加上 1.5 倍四分位距的位置,下须延伸至第 25 百分位减去 1.5 倍四分位距的位置。
潮滩宽度定义:
图片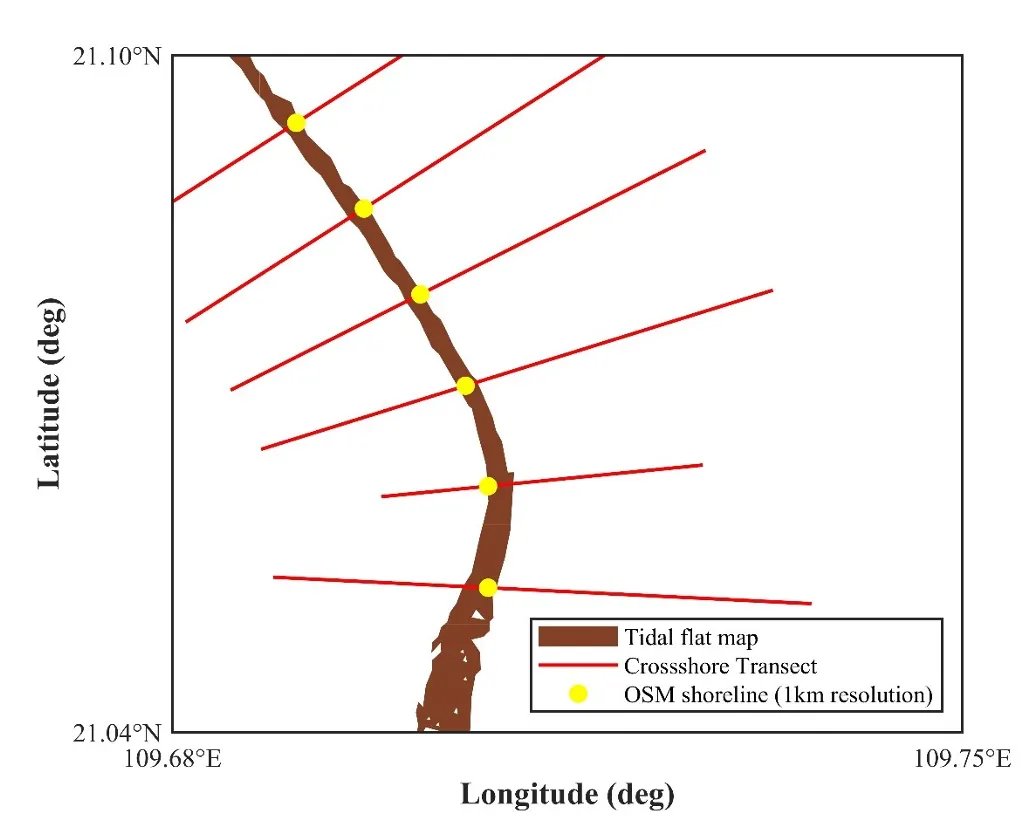
潮滩宽度截取方法。
棕色区域表示潮滩分布图,红色线段表示垂直于岸线的岸向剖面,黄色点表示 OSM(OpenStreetMap)岸线(分辨率为1公里)。
潮滩坡度定义:
图片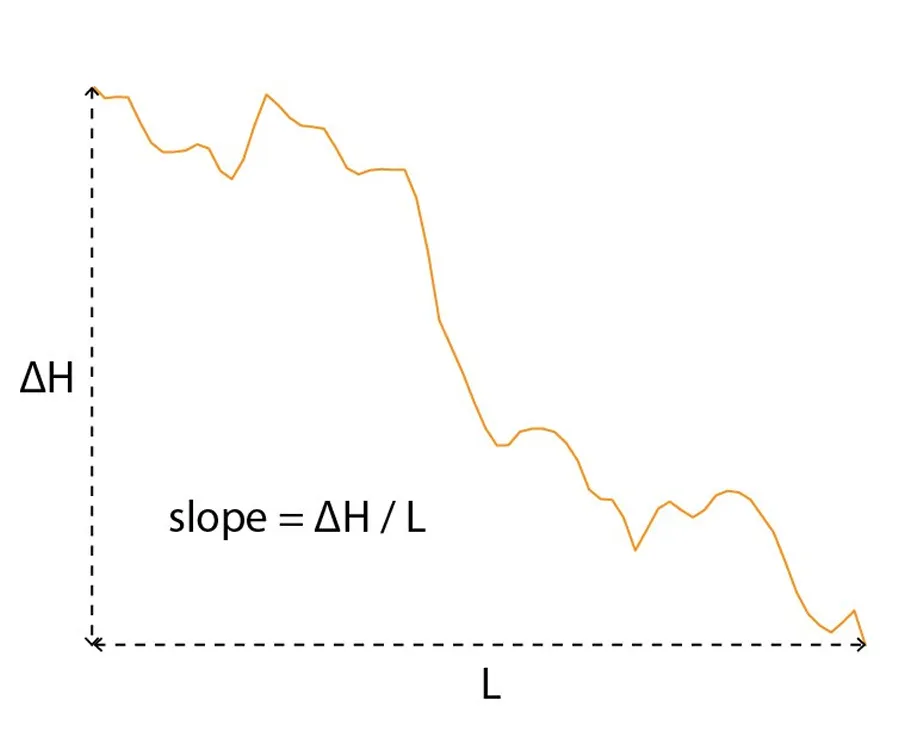
坡度计算方法。橙色线表示剖面高程分布。
matlab 代码:.rtcContent { padding: 30px; } .lineNode {font-size: 12pt; font-family: "Times New Roman", Menlo, Monaco, Consolas, "Courier New", monospace; font-style: normal; font-weight: normal; }
clear
load nearshore_province.mat
table_tidalflat = readtable('China_tidalflat.csv','VariableNamingRule','preserve');
tidalflat = table2array(table_tidalflat);
width_loc=isnan(tidalflat(:,6));%no width
tidalflat(width_loc,:)=[];
%%
World =shaperead('landareas.shp','UseGeoCoords',true);
ChinaL=shaperead('china1.shp');
ChinaP=shaperead('china2.shp');
rivers = shaperead('hyd2_4l.shp');
x=720;
y=710;
figure('Position', [0, 0, x, y])%550
cmap = [256,256,256;251 227 213;246 178 147;220 109 87;183 34 48;109,1,31]/256;
n = size(cmap, 1);
xq = linspace(1, n, 256);
cmap_smooth1 = interp1(1:n, cmap, xq, 'linear');
plot1 = subplot('Position', [60/x, 370/y, 200/x, 300/y]);
title('A','fontsize',15,'fontname','times new roman','fontweight','bold','position',[105,45])
hold on
geoshow(World,'facecolor',[.99 .99 .99],'edgecolor',[.3 .3 .3])
mapshow(ChinaL,'color',[.5 .5 .5])
mapshow(ChinaP(yanhai,:),'facecolor',[.7 .7 .7],'edgecolor',[.5 .5 .5])
mapshow(ChinaP(~yanhai,:),'facecolor',[.9 .9 .9],'edgecolor',[.5 .5 .5])
mapshow(rivers(heliu,:),'color',[.8 .8 .8])
scatter(tidalflat(:,2),tidalflat(:,3),8,log(tidalflat(:,6)),'filled')
load box_shandong.mat
patch('Faces',[1 2 3 4],'Vertices',polygon,...'EdgeColor','b','FaceColor','none','LineWidth',1.2)
text(mean(polygon(:,1)), max(polygon(:,2)), '74m' ,'Color','b','HorizontalAlignment', 'center', 'VerticalAlignment', 'bottom')
load box_jiangsu
patch('Faces',[1 2 3 4],'Vertices',polygon,...'EdgeColor','red','FaceColor','none','LineWidth',1.2)
text(mean(polygon(:,1)), max(polygon(:,2)), '3088m' ,'Color','red','HorizontalAlignment', 'center', 'VerticalAlignment', 'bottom')
ylabel('Latitude (deg)','FontSize',12,'fontweight','bold');
ax=gca;
ax.FontName = 'times new roman';
xticks([110 120])
xticklabels({'110°E','120°E'})
yticks([20 30 40])
yticklabels({'20°N','30°N','40°N'})
clim(log([min(tidalflat(:,6)) max(tidalflat(:,6))]));
colormap(cmap_smooth1);
cMap=colormap;
c = [10 100 1000 10000];
h = colorbar('Location', 'south', 'Position', [105/x, 300/y, 200/x, 20/y]);
set(h,'YTick',log(c),'YTickLabel',c,'fontsize',9);
ylabel(h,'Width (m)','fontsize',9,'fontname','times new roman')
xlim([105 125])
ylim([15 45])
ax.TickLength = [0.01, 0.01];
ax.LineWidth = 1.5;
ax.XRuler.TickDirection = 'out';
ax.YRuler.TickDirection = 'out';
ax.Layer = 'top';
box on
subplot('Position', [270/x, 370/y, 80/x, 300/y]);
latitudes = tidalflat(:, 3);
widths = tidalflat(:, 6);
bin_width = 0.5;
min_latitude = floor(min(latitudes)/bin_width)*bin_width;
max_latitude = ceil(max(latitudes)/bin_width)*bin_width;
num_bins = (max_latitude - min_latitude) / bin_width + 1;
averaged_widths = zeros(num_bins, 1);
percentile25 = zeros(num_bins, 1);
percentile75 = zeros(num_bins, 1);
for i = 1:num_bins-1lat_min = min_latitude + (i-1)*bin_width;lat_max = lat_min + bin_width;indices = find(tidalflat(:, 3) >= lat_min & tidalflat(:, 3) < lat_max);averaged_widths(i) = median(tidalflat(indices, 6));bin_widths = tidalflat(indices, 6);percentile25(i) = prctile(bin_widths, 25);percentile75(i) = prctile(bin_widths, 75);
end
latitudes_flipped = min_latitude + bin_width/2 : bin_width : max_latitude + bin_width/2;
plot(averaged_widths, latitudes_flipped, 'Color', [109,1,31]/256, 'LineWidth', 1);
hold on
fill([percentile25; flipud(percentile75)],[latitudes_flipped, fliplr(latitudes_flipped)], [109,1,31]/256,'edgecolor','none', 'FaceAlpha', 0.3);
box off
ax = gca;
pos = ax.Position;
xlim = ax.XLim;
ylim = ax.YLim;
ax.FontName = 'times new roman';
ax = gca;
xpos = ax.Position(1);
ypos = ax.Position(2);
xwidth = ax.Position(3);
ywidth = ax.Position(4);
annotation('arrow',[xpos,xpos+xwidth],[ypos,ypos],'Color','black','HeadLength',8,'HeadWidth',8,'LineWidth',0.5,'LineStyle','-');
annotation('arrow',[xpos,xpos],[ypos,ypos+ywidth],'Color','black','HeadLength',8,'HeadWidth',8,'LineWidth',0.5,'LineStyle','-');
xlabel('Width (units)');
axis([0, 8000, 15, 45])
set(gca, 'YTick', [])
set(gca, 'FontSize', 8)
set(gca, 'XTick', [0:2000:6000], 'XTickLabel', [0:2:6], 'FontSize', 9)
xlabel('Width (Km)', 'FontSize', 9)
%%
clearvars -except plot1 cMap x y province_list
load nearshore_province.mat
table_tidalflat = readtable('China_tidalflat.csv','VariableNamingRule','preserve');
tidalflat = table2array(table_tidalflat);
width_loc=isnan(tidalflat(:,4));
tidalflat(width_loc,:)=[];
nanloc1=tidalflat(:,4)<10^(-5);%no slope
tidalflat(nanloc1,:)=[];
%%
World =shaperead('landareas.shp','UseGeoCoords',true);
ChinaL=shaperead('china1.shp');
ChinaP=shaperead('china2.shp');
rivers = shaperead('hyd2_4l.shp');
bou2_4lx=[ChinaL(:).X];
bou2_4ly=[ChinaL(:).Y];
bou2_4px=[ChinaP(:).X];
bou2_4py=[ChinaP(:).Y];
subplot('Position',  [410/x, 370/y, 200/x, 300/y])
title('B','fontsize',15,'fontname','times new roman','fontweight','bold','position',[105,45])
cmap = [256,256,256;144 201 231;33 158 188;19 103 131;2,48,74]/256;
hold on
n = size(cmap, 1);
xq = linspace(1, n, 256);
cmap_smooth2 = interp1(1:n, cmap, xq, 'linear');
J = customcolormap([0 .35 .65 .95 1], flipud([256,256,256;144 201 231;33 158 188;19 103 131;2,48,74]/256),256);
geoshow(World,'facecolor',[.99 .99 .99],'edgecolor',[.3 .3 .3])
mapshow(ChinaL,'color',[.5 .5 .5])
mapshow(ChinaP(yanhai,:),'facecolor',[.7 .7 .7],'edgecolor',[.5 .5 .5])
mapshow(ChinaP(~yanhai,:),'facecolor',[.9 .9 .9],'edgecolor',[.5 .5 .5])
mapshow(rivers(heliu,:),'color',[.8 .8 .8])
scatter(tidalflat(:,2),tidalflat(:,3),8,tidalflat(:,4),'filled')
load box_fujian.mat
patch('Faces',[1 2 3 4],'Vertices',polygon,...'EdgeColor','r','FaceColor','none','LineWidth',1.2)
text(mean(polygon(:,1)), max(polygon(:,2)), '1.8\times10^{-2}' ,'Color','r','HorizontalAlignment', 'center', 'VerticalAlignment', 'bottom')
load box_jiangsu.mat
patch('Faces',[1 2 3 4],'Vertices',polygon,...'EdgeColor','b','FaceColor','none','LineWidth',1.2)
text(mean(polygon(:,1)), max(polygon(:,2)), '2.3\times10^{-3}' ,'Color','b','HorizontalAlignment', 'center', 'VerticalAlignment', 'bottom')
xlabel('Longitude (deg)','FontSize',12,'fontweight','bold');
xlabh = get(gca,'xlabel');
ylabel('Latitude (deg)','FontSize',12,'fontweight','bold');
ylabh = get(gca,'ylabel');
ax=gca;
ax.FontName = 'times new roman';
xticks([110 120])
xticklabels({'110°E','120°E'})
yticks([20 30 40])
yticklabels({'20°N','30°N','40°N'})
colormap(J);
h = colorbar('Location', 'south', 'Position', [455/x, 300/y, 200/x, 20/y]);
set(h,'fontsize',9);
ylabel(h,'Slope','fontsize',9,'fontname','times new roman')
set(plot1, 'Colormap', cMap);
xlim([105 125])
ylim([15 45])
ax.TickLength = [0.01, 0.01];
ax.LineWidth = 1.5;
ax.XRuler.TickDirection = 'out';
ax.YRuler.TickDirection = 'out';
ax.Layer = 'top';
box on
%%%%%%%%%%%%%%%%%%%%%%%%%%%%%%%%%%%%%%%%%%%%%%%%%%%%%%%%%%%%%%%%%%%%%%%%
subplot('Position', [620/x, 370/y, 80/x, 300/y])
latitudes = tidalflat(:, 3);
widths = tidalflat(:, 4);
bin_width = 0.5;
min_latitude = floor(min(latitudes)/bin_width)*bin_width;
max_latitude = ceil(max(latitudes)/bin_width)*bin_width;
num_bins = (max_latitude - min_latitude) / bin_width + 1;
averaged_widths = zeros(num_bins, 1);
percentile25 = zeros(num_bins, 1);
percentile75 = zeros(num_bins, 1);
for i = 1:num_bins-1lat_min = min_latitude + (i-1)*bin_width;lat_max = lat_min + bin_width;indices = find(tidalflat(:, 3) >= lat_min & tidalflat(:, 3) < lat_max);averaged_widths(i) = median(tidalflat(indices, 4));bin_widths = tidalflat(indices, 4);percentile25(i) = prctile(bin_widths, 25);percentile75(i) = prctile(bin_widths, 75);
end
latitudes_flipped = min_latitude + bin_width/2 : bin_width : max_latitude + bin_width/2;
plot(averaged_widths, latitudes_flipped, 'Color', [2,48,74]/256, 'LineWidth', 1);
hold on
fill([percentile25; flipud(percentile75)],[latitudes_flipped, fliplr(latitudes_flipped)], [2,48,74]/256,'edgecolor','none', 'FaceAlpha', 0.3);
box off
ax = gca;
xpos = ax.Position(1);
ypos = ax.Position(2);
xwidth = ax.Position(3);
ywidth = ax.Position(4);
ax.FontName = 'times new roman';
annotation('arrow',[xpos,xpos+xwidth],[ypos,ypos],'Color','black','HeadLength',8,'HeadWidth',8,'LineWidth',0.5,'LineStyle','-');
annotation('arrow',[xpos,xpos],[ypos,ypos+ywidth],'Color','black','HeadLength',8,'HeadWidth',8,'LineWidth',0.5,'LineStyle','-');
xlabel('Width (units)');
ylim([15 45])
set(gca, 'YTick', [])
set(gca, 'FontSize', 8)
set(gca, 'XTick', [0.02 0.04], 'XTickLabel', [0.02 0.04], 'FontSize', 9)
xlabel('Slope', 'FontSize', 9)
%%
clearvars -except plot1 cMap x y
table_tidalflat = readtable('China_tidalflat.csv','VariableNamingRule','preserve');
tidalflat = table2array(table_tidalflat);
width_loc=find(isnan(tidalflat(:,6)));
tidalflat(width_loc,:)=[];
width_loc2=find(isnan(tidalflat(:,4)));
tidalflat(width_loc2,:)=[];
nanloc1=find(tidalflat(:,4)==0);
tidalflat(nanloc1,:)=[];
slope0 = tidalflat(:, 6);
% Load data from file
slope1 = tidalflat(:, 6);
slope_avg = tidalflat(:, 4);
% Divide slope into 20 bins
nbins = 8;
bin_edges = [0 50 100 200 400 600 1000 1500 30000];
bin_counts = histcounts(slope1, bin_edges);
lo=8;
% Prepare data for boxplot
bin_indices = discretize(slope1, bin_edges);
boxplot_data = cell(lo, 1);
for i = 1:loboxplot_data{i} = slope_avg(bin_indices == i);
end
X2 = strings(1, lo);
for i = 1:loX2(i) = sprintf('%.0f - %.0f', bin_edges(i), bin_edges(i+1));
end
X2(end) = ">1500";
% X2 = categorical(X2, X2);
% Plot the boxplot
subplot('Position', [60/x, 60/y, 600/x, 160/y])
boxplot(slope_avg,bin_indices,'Labels',X2, ...'Widths', 0.7, 'Colors', 'k', 'Symbol', '', 'Whisker', 1, 'Notch', 'on');
boxes = findobj(gca, 'Tag', 'Box');
yy = accumarray(discretize(slope1, bin_edges), slope_avg, [], @median);
for i =1:length(yy)
colors(i,:) = [182-(yy(i)-min(yy))/ ...(max(yy)-min(yy))*180 215-(yy(i)-min(yy))/(max(yy)-min(yy)) ...*167 232-(yy(i)-min(yy))/(max(yy)-min(yy))*158]/256 ;
end
colors = flipud(colors);
for j = 1:length(yy)patch(get(boxes(j), 'XData'), get(boxes(j), 'YData'), colors(j, :));
end
% 修改中位数线的颜色,使其与箱体颜色一致
medians = findobj(gca, 'Tag', 'Median');
for j = 1:length(medians)x = get(medians(j), 'XData');y = get(medians(j), 'YData');line(x, y, 'Color', 'w', 'LineWidth', 1); % 重新绘制中位数线,设置颜色和线宽
end
hold on
for i = 1:lo-1text(i, prctile(boxplot_data{i},75), strcat('N = ', num2str(bin_counts(i))), ...'HorizontalAlignment', 'center', 'VerticalAlignment', 'top', ...'Color', 'w', 'FontName', 'times new roman');
end
i = lo;
text(i,0.0056159,strcat('N = ', num2str(bin_counts(i))), 'HorizontalAlignment', 'center', 'VerticalAlignment', 'bottom', 'Color', 'k','FontName', 'times new roman')
box off
ax = gca;
ax.FontSize = 9;
ax.FontName = 'times new roman';
xlabel('Width (m)', 'FontSize', 12, 'fontweight', 'bold')
ylabel('Median of Slope', 'FontSize', 12, 'fontweight', 'bold')
ax.TickLength = [0.005, 0.005];
ax.LineWidth = 1.5;
ax.XGrid = 'off';
ax.YGrid = 'off';
ax.XRuler.TickDirection = 'out';
ax.YRuler.TickDirection = 'out';
ax.Layer = 'top';
ylim([-0.001 0.04])
title('C', 'fontsize', 15, 'fontname', 'times new roman', 'fontweight', 'bold', 'position', [0.5, 0.04])
%%
set(gcf,'Units','Inches');
pos = get(gcf,'Position');
set(gcf,'PaperPositionMode','Auto','PaperUnits','Inches','PaperSize',[pos(3), pos(4)])
print('-djpeg','-r300','中国沿岸潮滩宽度和坡度分布.jpg')参考文献:
Liu, S., Hu, Z., Grandjean, T.J.et al.Dynamics and drivers of tidal flat morphology in China.Nat Commun16, 2153 (2025). https://doi.org/10.1038/s41467-025-57525-y
参考文献:
Liu, S., Hu, Z., Grandjean, T.J.et al.Dynamics and drivers of tidal flat morphology in China.Nat Commun16, 2153 (2025). https://doi.org/10.1038/s41467-025-57525-y