Openlayers:实现聚合
一、什么是聚合
聚合是一种将一定范围内的多个图形合并为一个图形的一种技术方案。通常用来解决图形过于集中或者图形数量过多的问题。
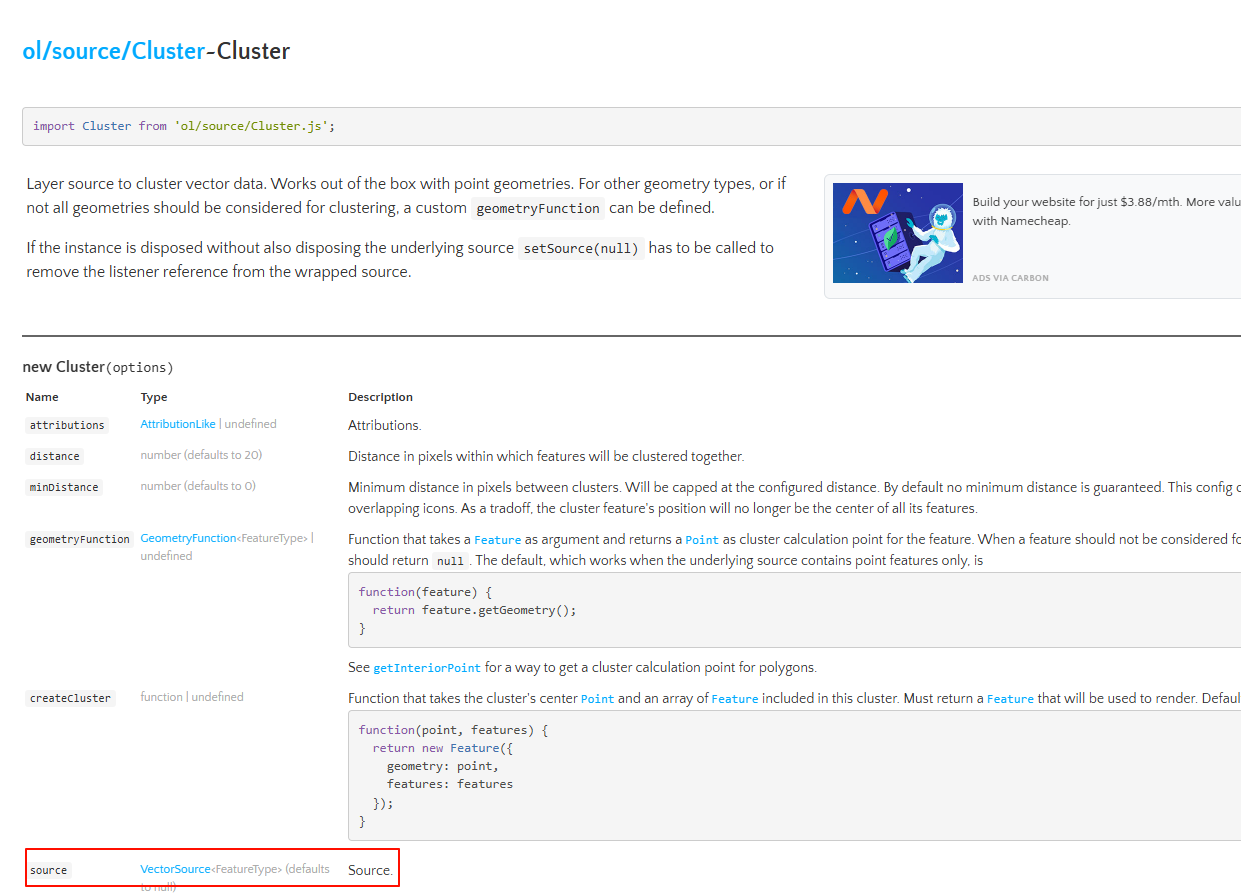
在Openlayers中主要通过Cluster数据源来实现聚合的效果。与其它的数据源不同,Cluster数据源在实例化时需要接收一个矢量数据源作为参数,然后在将Cluster数据源作为一个矢量图层的数据源,这样就能实现对矢量数据源中图形的聚合。
二、如何实现聚合
1.点聚合
如果是有一些点要素需要全部进行聚合,像这种情况实现起来就非常简单,只需要通过distance属性(以像素为单位)设置好聚合的范围就可以了。
// 矢量数据源
const weatherStationSource = new VectorSource({
format: new GeoJSON(),
url: "src/data/气象站点/stations-wgs.geojson",
});
// 聚合数据源
const clusterSource = new Cluster({
distance: 40,
source: weatherStationSource,
});
const weatherStationLayer = new VectorLayer({
properties: {
name: "气象站点",
id: "weather-station",
},
source: clusterSource,
});
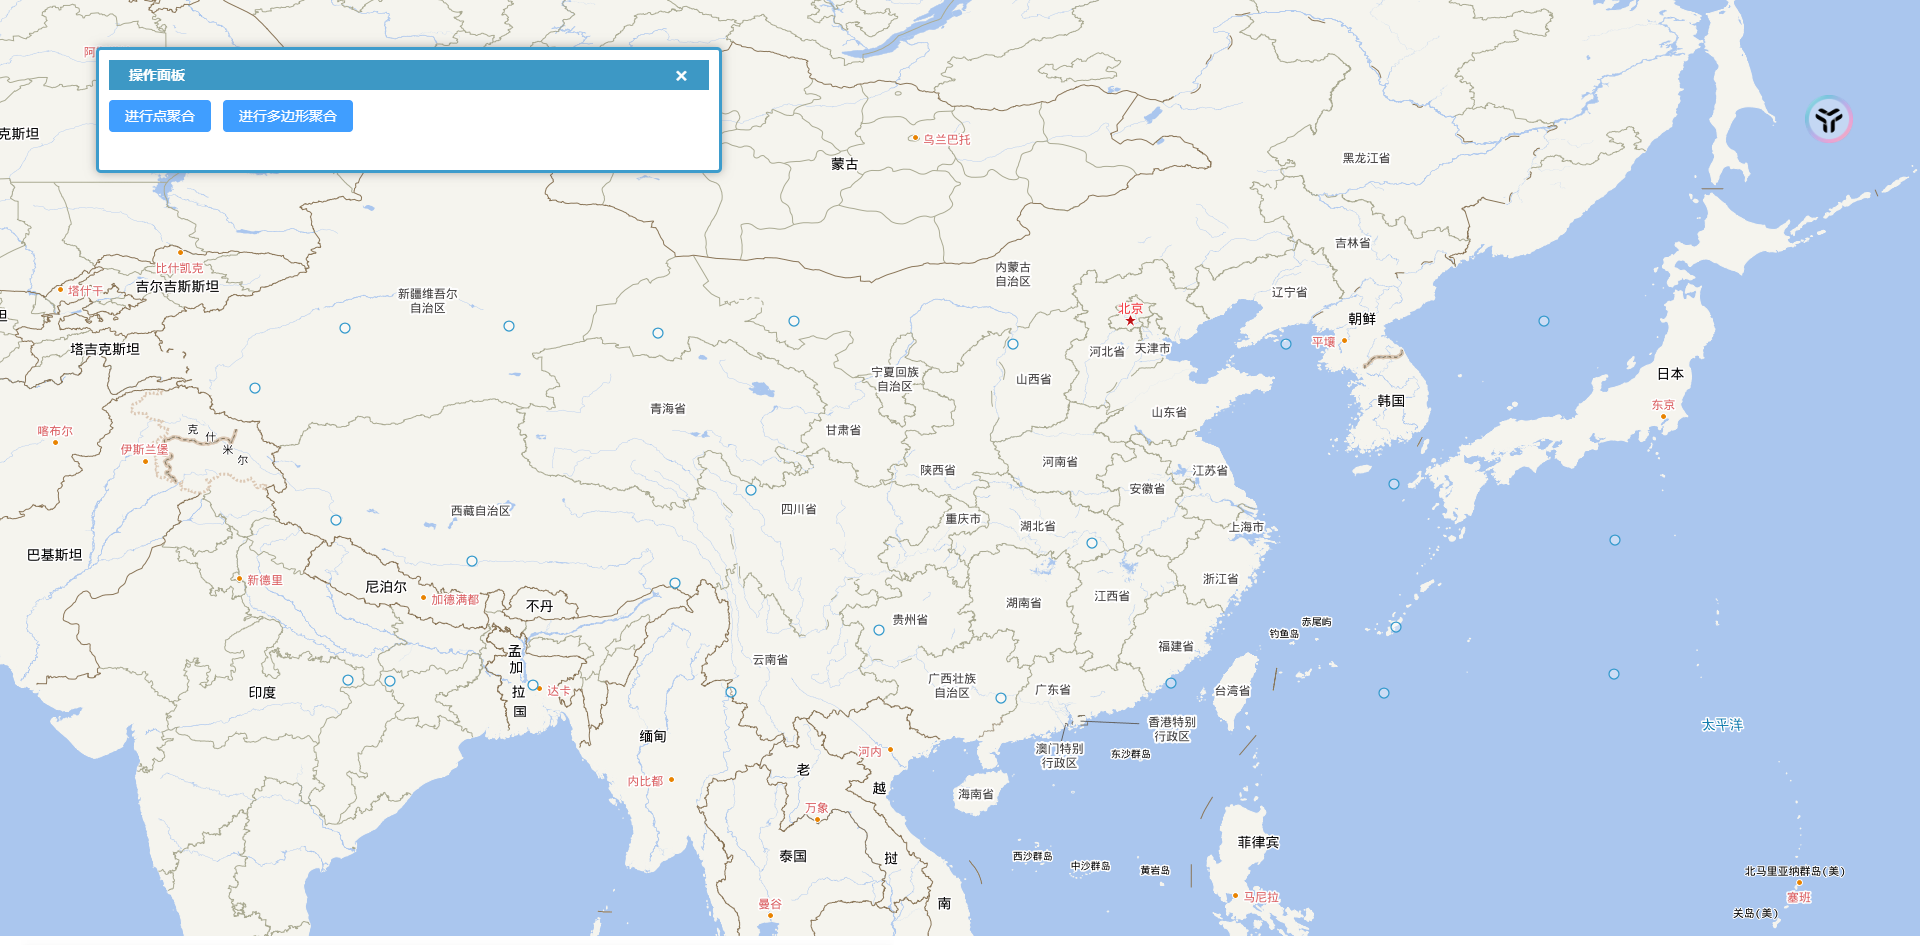
window.map.addLayer(weatherStationLayer);聚合前:
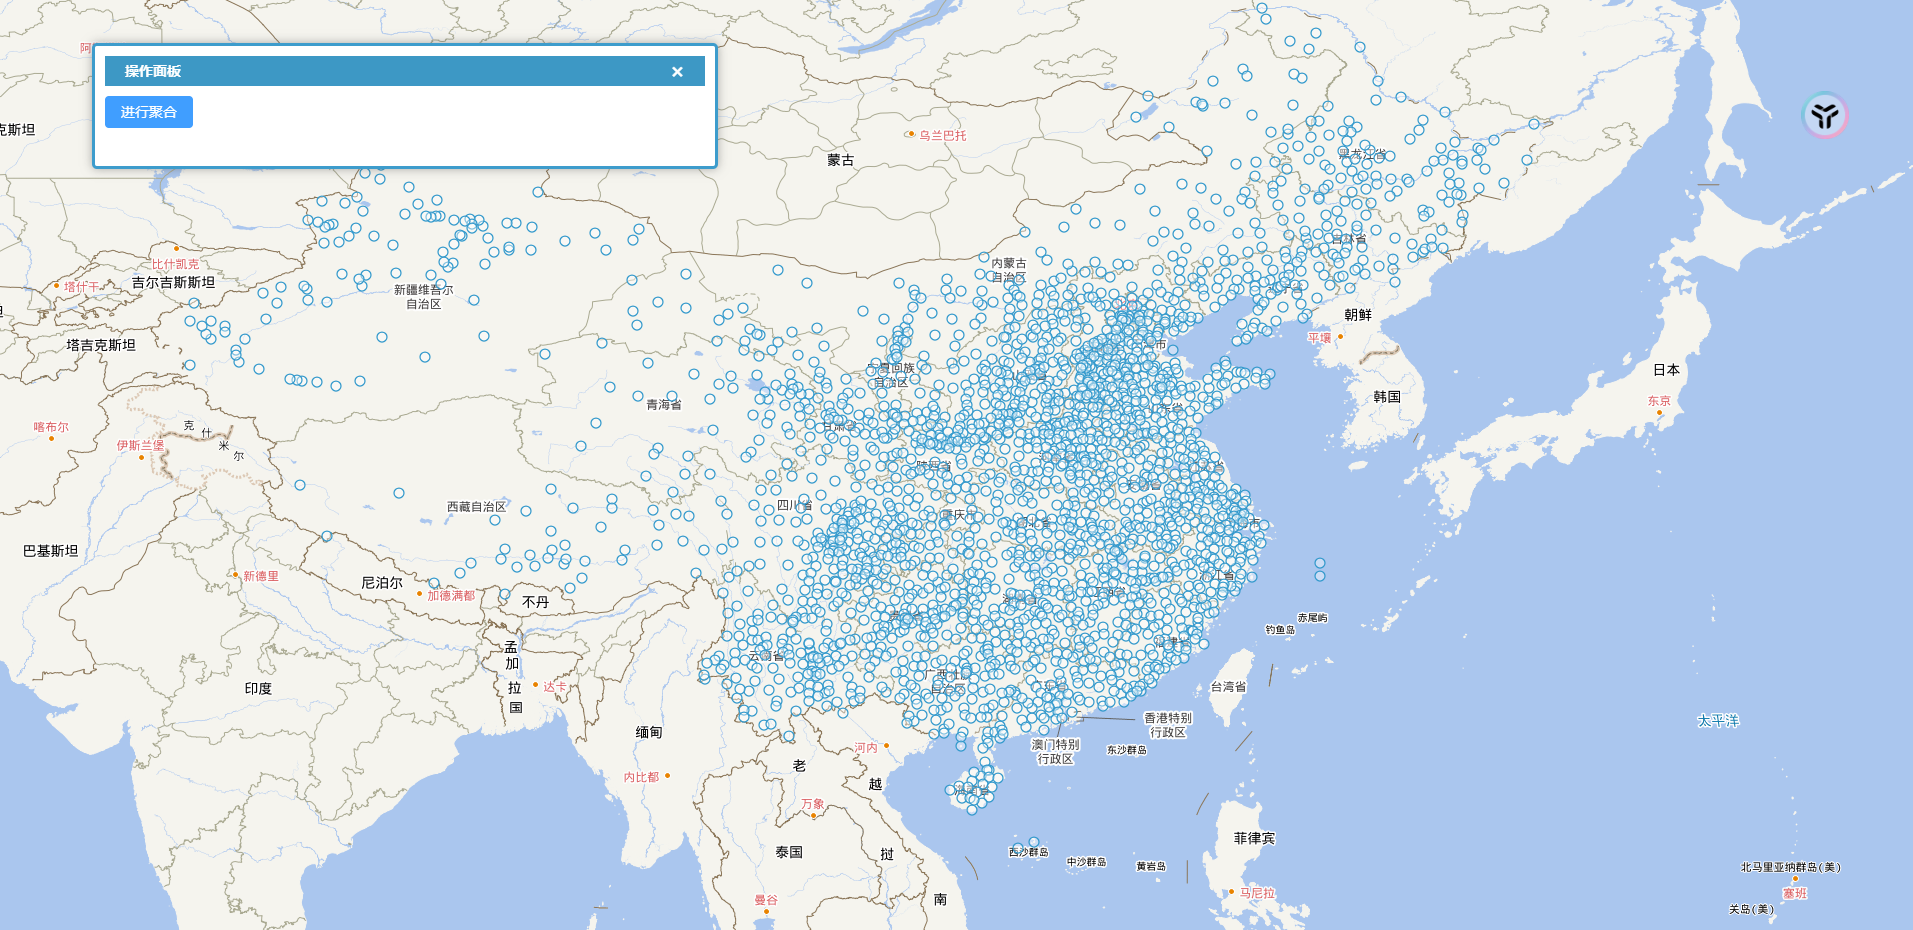
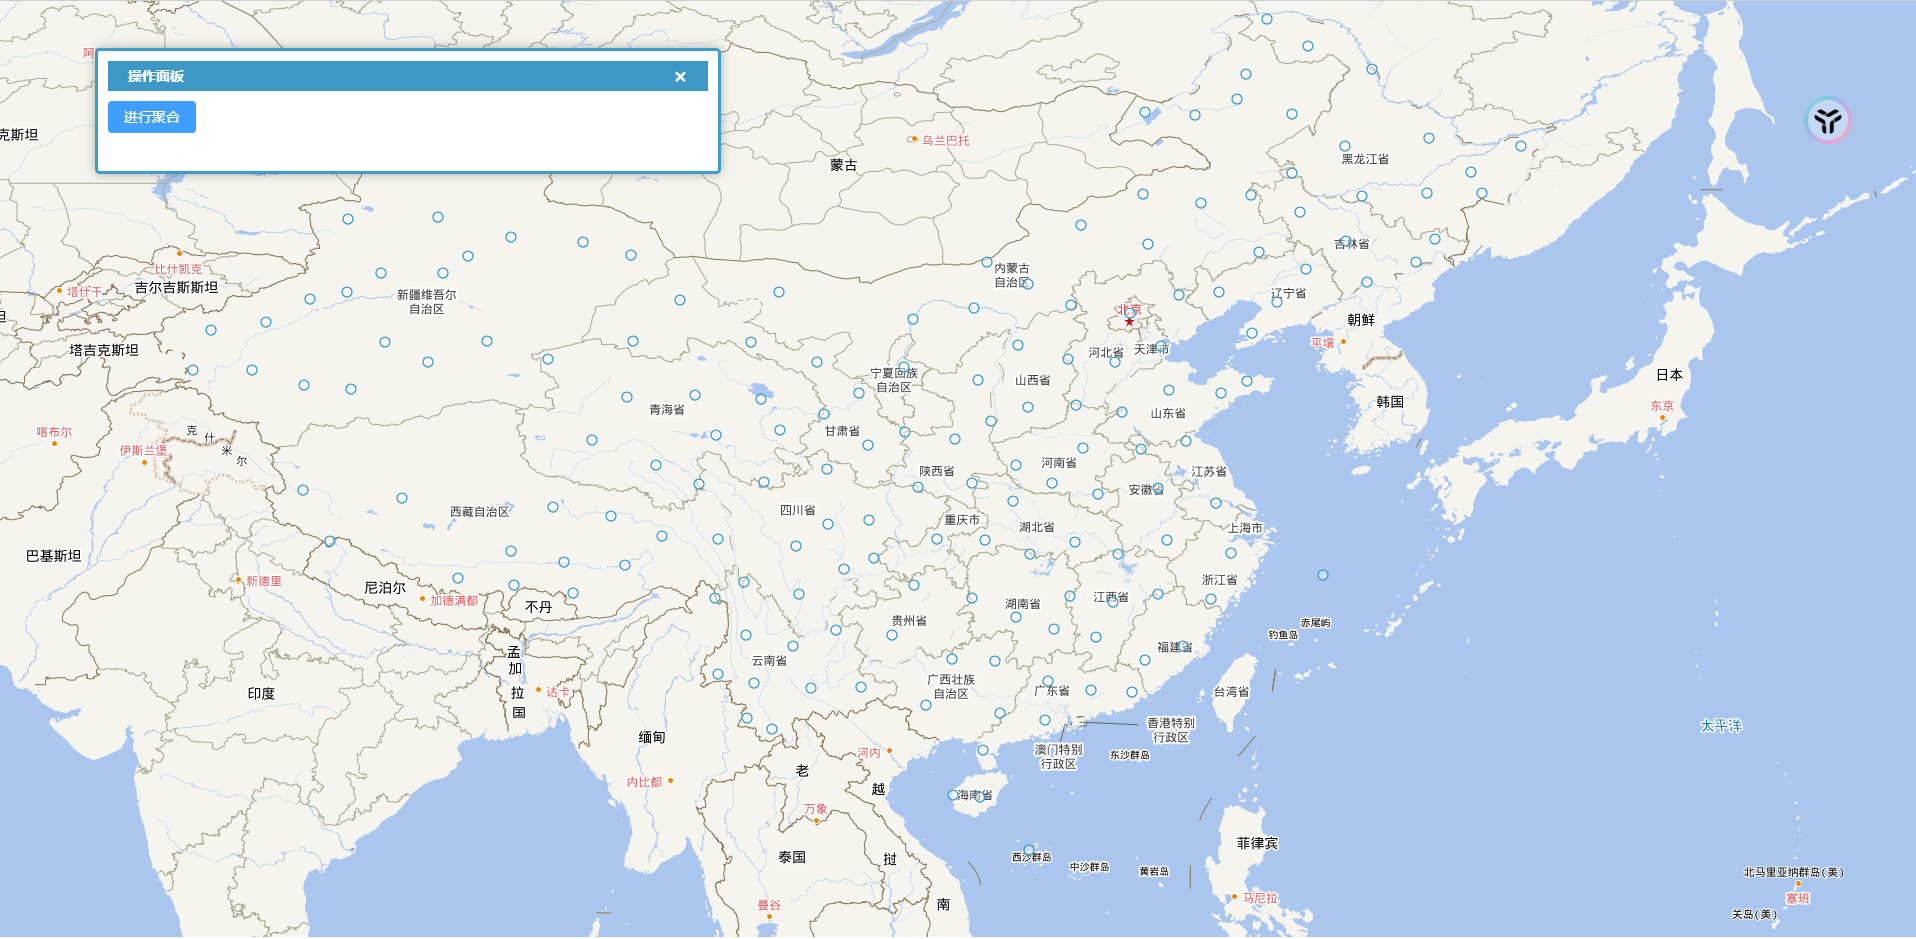
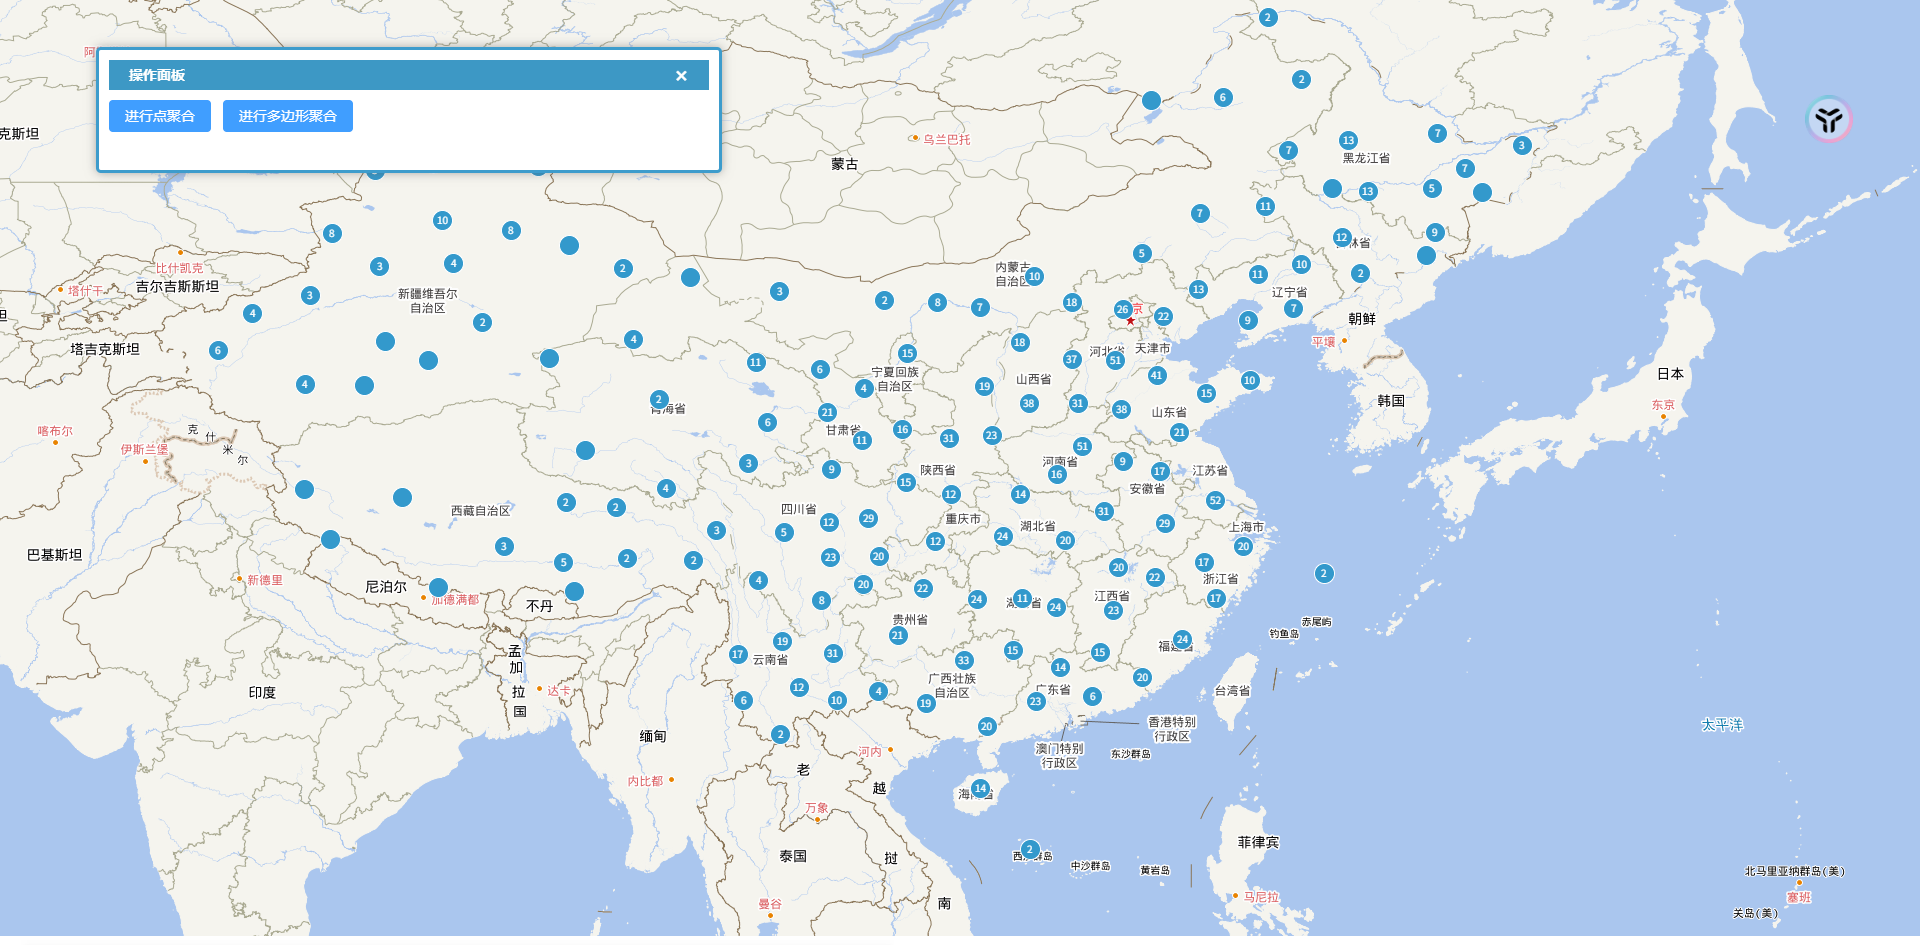
聚合后:
2.部分图形聚合
有的时候我们并不希望将矢量数据源中的所有图形都参与聚合,这个时候可以通过geometryFunction属性进行设置。
geometryFunction属性是一个函数,该函数以一个要素(Feature)作为参数,并返回一个点(Point),以此作为该要素用于聚合计算的点。当某个要素不应被纳入聚类考虑范围时,该函数应返回null。
注意,如果返回null就相当于矢量数据源中没有这个图形。
  // 矢量数据源
  const weatherStationSource = new VectorSource({
    format: new GeoJSON(),
    url: "src/data/气象站点/stations-wgs.geojson",
  });

  // 聚合数据源
  const clusterSource = new Cluster({
    distance: 40,
    source: weatherStationSource,
    geometryFunction: function (feature) {
      const type = feature.get("type");
      console.log(type);

      if (type == "基本站") {
        return null;
      }

      return feature.getGeometry();
    },
  });

  const weatherStationLayer = new VectorLayer({
    properties: {
      name: "气象站点",
      id: "weather-station",
    },
    source: clusterSource,
  });

  window.map.addLayer(weatherStationLayer);
3.其它图形的聚合
如果需要进行聚合的是点以外的其它图形,例如多边形,那么就必须设置geometryFunction属性,以指定用于聚合计算的点。对于多边形来说我们可以使用Polygon.getInteriorPoint()方法获取多边形的中心点来进行聚合计算。
  // 矢量数据源
  const polygonSource = new VectorSource({
    features: randomPolygonFeature(window.map, 1000),//随机生成1000个多边形
  });

  const clusterSource = new Cluster({
    distance: 40,
    source: polygonSource,
    geometryFunction: function (feature) {
      return feature.getGeometry().getInteriorPoint();
    },
  });

  const polygonLayer = new VectorLayer({
    properties: {
      name: "多边形图层",
      id: "polygonLayer",
    },
    source: clusterSource,
  });

  window.map.addLayer(polygonLayer);
聚合前:
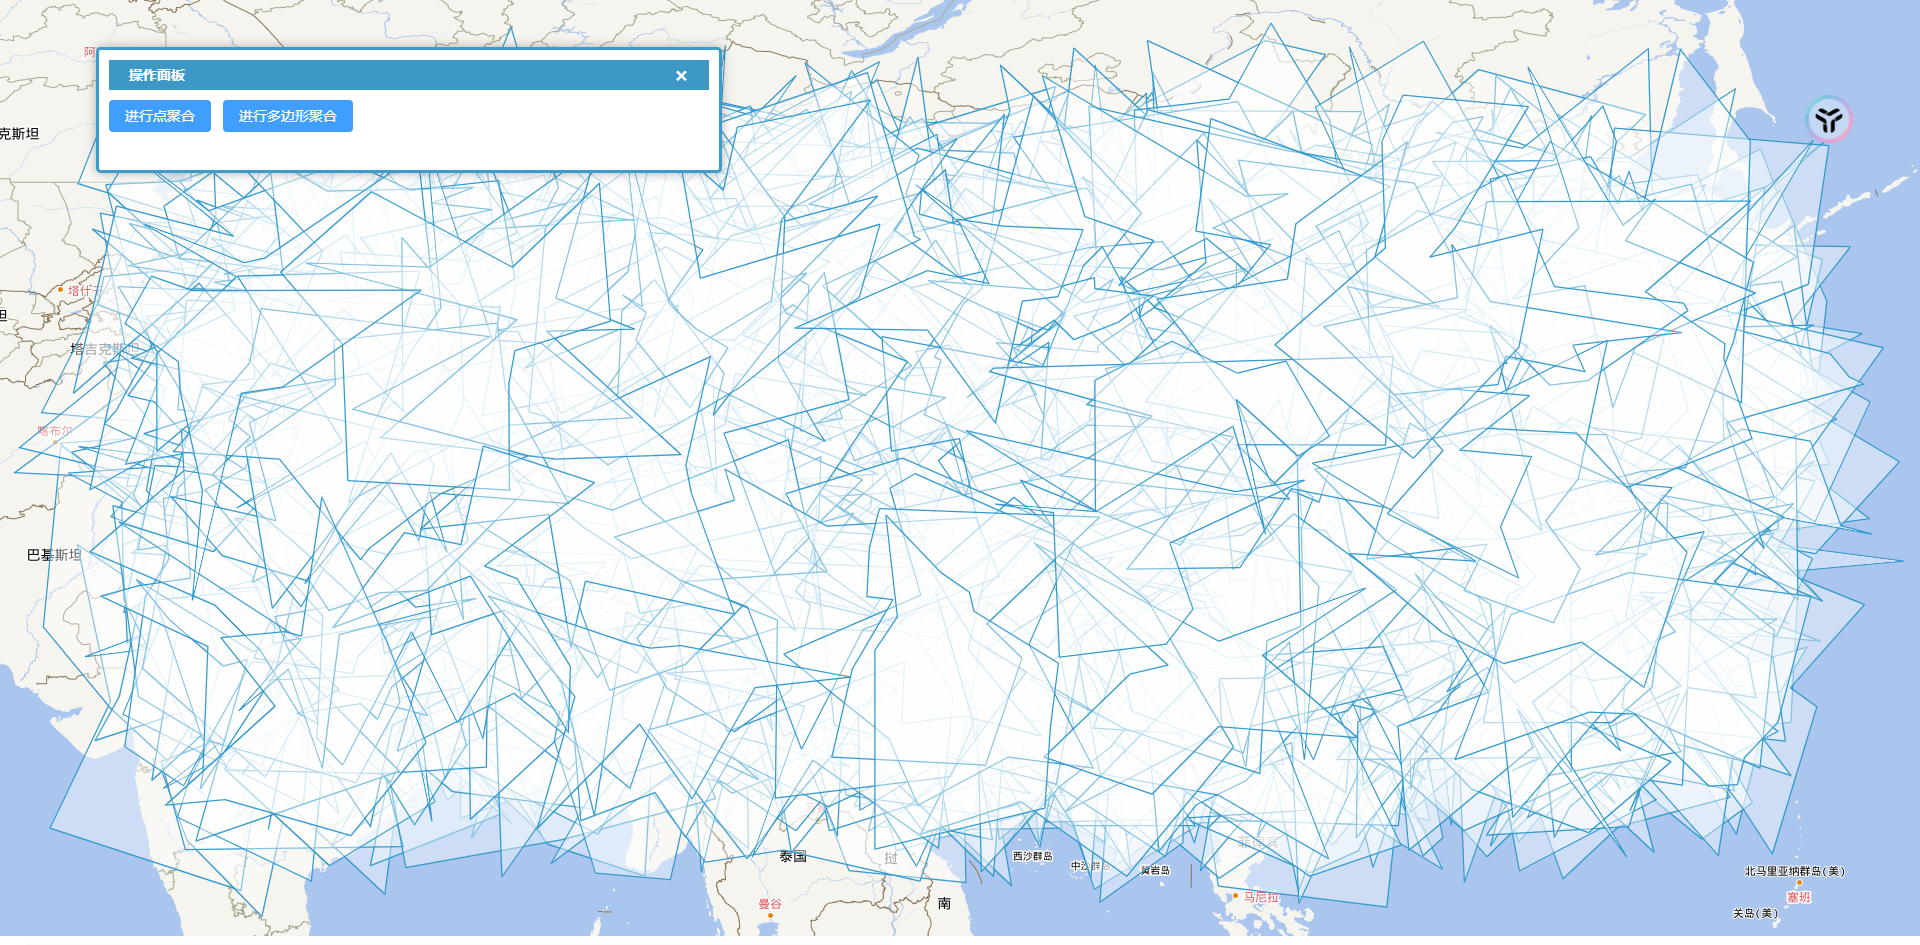
聚合后:
4.自定义聚合图形
从之前的示例可以看到,聚合后的聚合图形都是点,如果希望使用其它的图形作为聚合图形,那就需要使用createCluster属性进行自定义。
createCluster属性也是一个函数,该函数接受聚合的中心点以及包含在该聚合中的要素数组作为参数。它必须返回一个将用于渲染的要素。
通过下面的代码就可以将一个小正方形作为聚合的图形:
  // 矢量数据源
  const polygonSource = new VectorSource({
    features: randomPolygonFeature(window.map, 1000),
  });

  const clusterSource = new Cluster({
    distance: 40,
    source: polygonSource,
    geometryFunction: function (feature) {
      return feature.getGeometry().getInteriorPoint();
    },
    createCluster: function (point, features) {
      // 定义中心点
      const centerPoint = point.getCoordinates();
      // 定义正方形的半边长
      const halfSideLength = 0.5;

      // 计算正方形的四个顶点
      const topLeft = [
        centerPoint[0] - halfSideLength,
        centerPoint[1] + halfSideLength,
      ];
      const topRight = [
        centerPoint[0] + halfSideLength,
        centerPoint[1] + halfSideLength,
      ];
      const bottomRight = [
        centerPoint[0] + halfSideLength,
        centerPoint[1] - halfSideLength,
      ];
      const bottomLeft = [
        centerPoint[0] - halfSideLength,
        centerPoint[1] - halfSideLength,
      ];

      // 创建正方形的多边形坐标
      const squareCoordinates = [
        topLeft,
        topRight,
        bottomRight,
        bottomLeft,
        topLeft, // 闭合多边形
      ];

      // 创建多边形要素
      const squareFeature = new Feature({
        geometry: new Polygon([squareCoordinates]),
        features: features,
      });

      return squareFeature;
    },
  });

  const polygonLayer = new VectorLayer({
    properties: {
      name: "多边形图层",
      id: "polygonLayer",
    },
    source: clusterSource,
  });

  window.map.addLayer(polygonLayer);
三、优化聚合效果
1.显示聚合的数量
有一种常见的聚合优化的效果就是在聚合点上显示聚合的图形的数量。
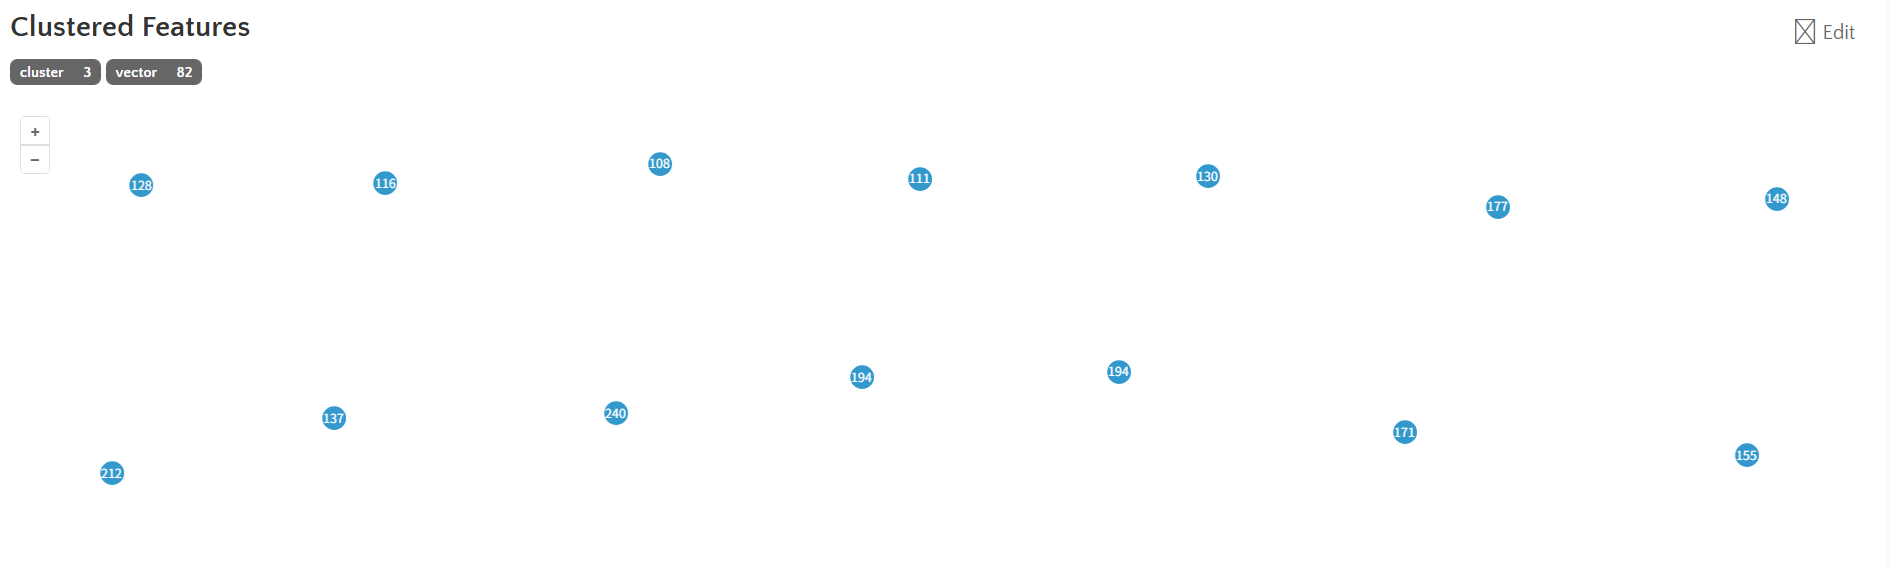
这种效果需要通过给矢量图层设置样式来实现。
可以使用普通样式来实现:
  // 缓存样式
  const styleCache = new Map([
    [
      1,
      new Style({
        image: new CircleStyle({
          radius: 10,
          stroke: new Stroke({
            color: "#fff",
          }),
          fill: new Fill({
            color: "#3399CC",
          }),
        }),
      }),
    ],
  ]);
  weatherStationLayer.setStyle(function (feature) {
    const size = feature.get("features").length;

    let style = styleCache.get(size);

    if (!style) {
      style = new Style({
        image: new CircleStyle({
          radius: 10,
          stroke: new Stroke({
            color: "#fff",
          }),
          fill: new Fill({
            color: "#3399CC",
          }),
        }),
        text: new Text({
          text: size.toString(),
          fill: new Fill({
            color: "#fff",
          }),
        }),
      });

      styleCache.set(size, style);
    }

    return style;
  });
当然也可以使用flat样式实现:
  weatherStationLayer.setStyle([
    {
      filter: [">", ["get", "features", "length"], 1],
      style: [
        {
          "circle-radius": 10, //圆半径
          "circle-fill-color": "#3399CC", //圆填充颜色
          "circle-stroke-width": 1.25, //圆边框宽度
          "circle-stroke-color": "#fff", //圆边框颜色
        },
        {
          "text-value": ["to-string", ["get", "features", "length"]], //文本内容
          "text-fill-color": "#fff", //文本颜色
        },
      ],
    },
    {
      else: true,
      style: [
        {
          "circle-radius": 10, //圆半径
          "circle-fill-color": "#3399CC", //圆填充颜色
          "circle-stroke-width": 1.25, //圆边框宽度
          "circle-stroke-color": "#fff", //圆边框颜色
        },
      ],
    },
  ]);
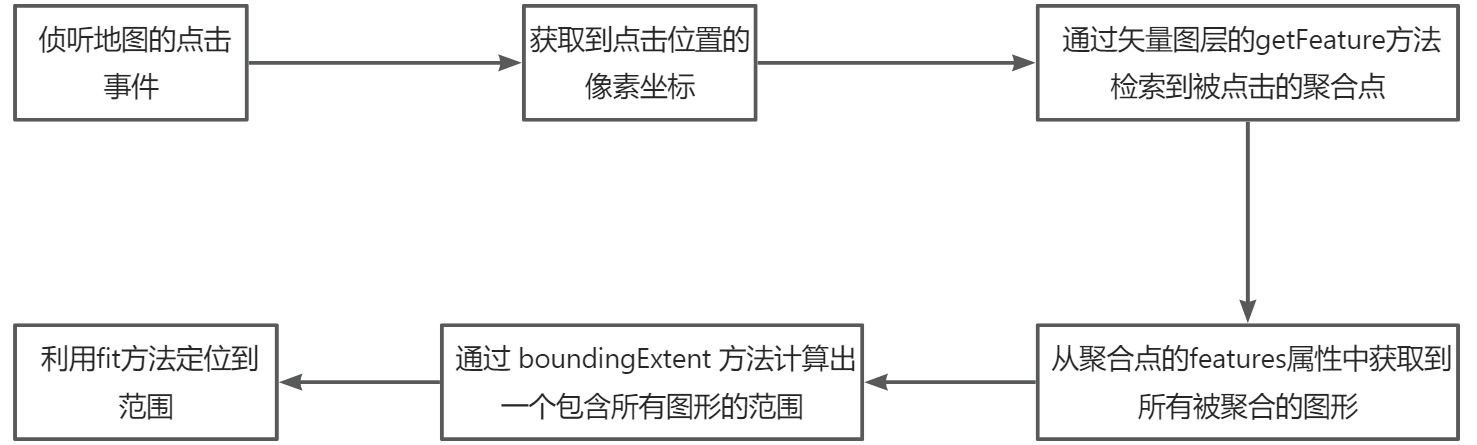
2.点击聚合点放大视图展示构成聚合点的要素
这是一个常用的聚合的交互效果,它基本的实现思路如下:
  map.on("click", e => {
    weatherStationLayer.getFeatures(e.pixel).then(clickedFeatures => {
      if (clickedFeatures.length) {
        // Get clustered Coordinates
        const features = clickedFeatures[0].get("features");
        if (features.length > 1) {
          const extent = boundingExtent(
            features.map(r => r.getGeometry().getCoordinates())
          );
          map
            .getView()
            .fit(extent, { duration: 1000, padding: [50, 50, 50, 50] });
        }
      }
    });
  });
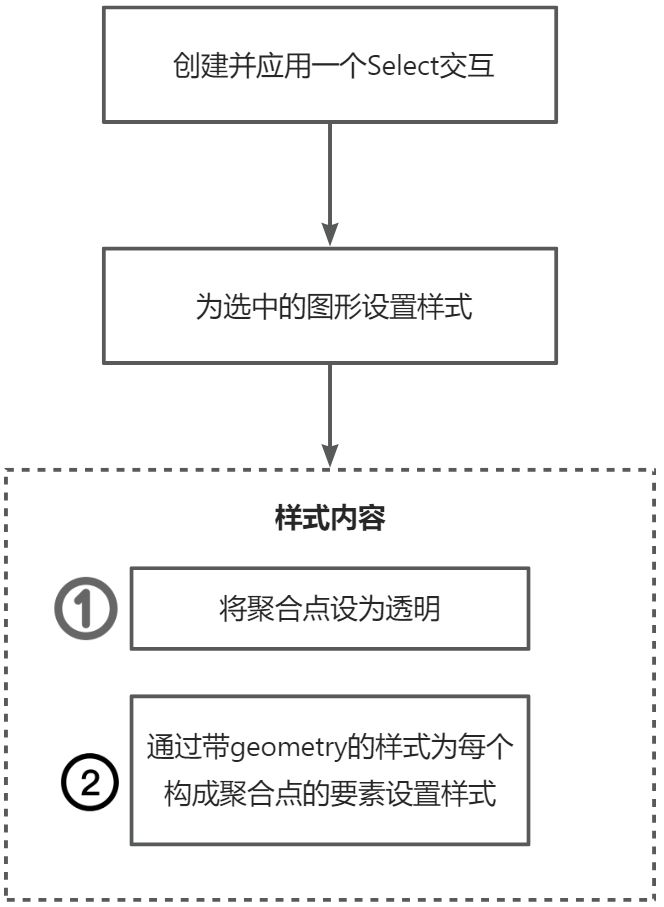
3.鼠标悬停到聚合点时展示构成该聚合点的各个要素
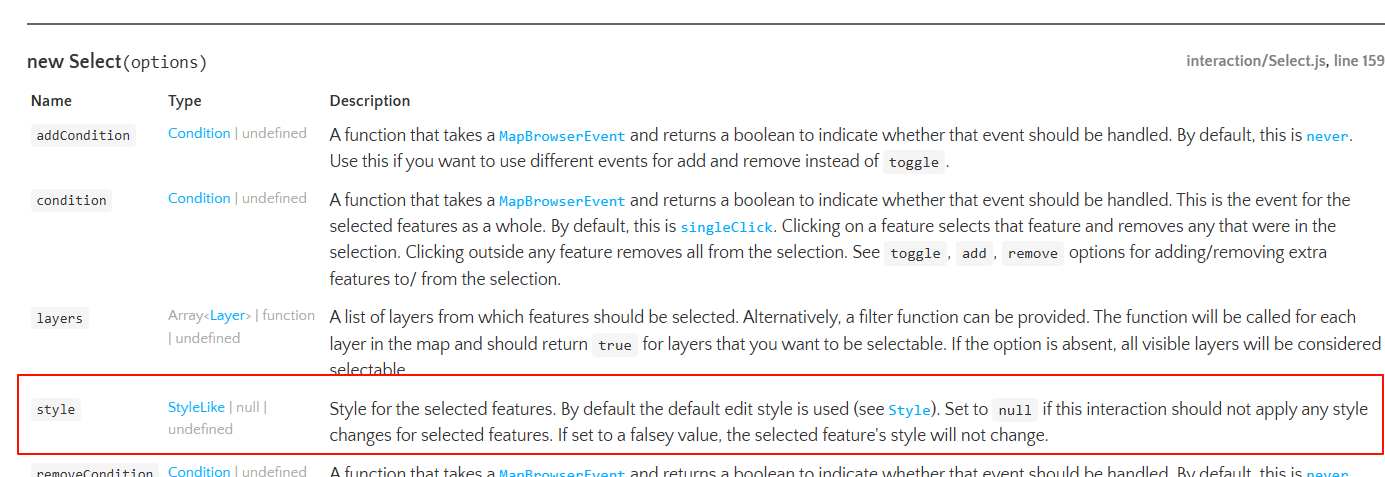
想要实现这种效果就不能继续使用地图事件了(其实也可以,但是会很麻烦),推荐通过 Select 交互来实现,它的style属性可以为选中的图形设置样式。
整体的思路如下:
  // 矢量数据源
  const weatherStationSource = new VectorSource({
    format: new GeoJSON(),
    url: "src/data/气象站点/stations-wgs.geojson",
  });

  // 聚合数据源
  const clusterSource = new Cluster({
    distance: 40,
    source: weatherStationSource,
    geometryFunction: function (feature) {
      const type = feature.get("type");

      if (type == "基本站") {
        return null;
      }

      return feature.getGeometry();
    },
  });

  // 矢量图层
  const weatherStationLayer = new VectorLayer({
    properties: {
      name: "气象站点",
      id: "weather-station",
    },
    source: clusterSource,
  });

  // 聚合样式
  weatherStationLayer.setStyle([
    {
      filter: [">", ["get", "features", "length"], 1],
      style: [
        {
          "circle-radius": 10, //圆半径
          "circle-fill-color": "#3399CC", //圆填充颜色
          "circle-stroke-width": 1.25, //圆边框宽度
          "circle-stroke-color": "#fff", //圆边框颜色
        },
        {
          "text-value": ["to-string", ["get", "features", "length"]], //文本内容
          "text-fill-color": "#fff", //文本颜色
        },
      ],
    },
    {
      else: true,
      style: [
        {
          "circle-radius": 10, //圆半径
          "circle-fill-color": "#3399CC", //圆填充颜色
          "circle-stroke-width": 1.25, //圆边框宽度
          "circle-stroke-color": "#fff", //圆边框颜色
        },
      ],
    },
  ]);

  window.map.addLayer(weatherStationLayer);


  // 定义选中聚合点时的样式
  function selectStyleFunction(feature) {
    const styles = [
      new Style({
        image: new CircleStyle({
          radius: 10,
          fill: new Fill({
            color: "rgba(255, 255, 255, 0.01)",
          }),
        }),
      }),
    ];
    const originalFeatures = feature.get("features");
    let originalFeature;
    for (let i = originalFeatures.length - 1; i >= 0; --i) {
      originalFeature = originalFeatures[i];
      styles.push(
        new Style({
          geometry: originalFeature.getGeometry(),
          image: new RegularShape({
            radius: 3,
            radius2: 7,
            points: 5,
            angle: Math.PI,
            fill: new Fill({
              color: "rgba(255, 153, 0, 0.8)",
            }),
            stroke: new Stroke({
              color: "rgba(255, 204, 0, 0.2)",
              width: 1,
            }),
          }),
        })
      );
    }
    return styles;
  }

  // 定义选中聚合点的交互
  const select = new Select({
    condition: function (evt) {
      return evt.type == "pointermove" || evt.type == "singleclick";
    },
    style: selectStyleFunction,
  });

  window.map.addInteraction(select);
参考资料
- OpenLayers v10.5.0 API - Class: Cluster
- Clustered Features
- Earthquake Clusters
- OpenLayers v10.5.0 API - Class: Select