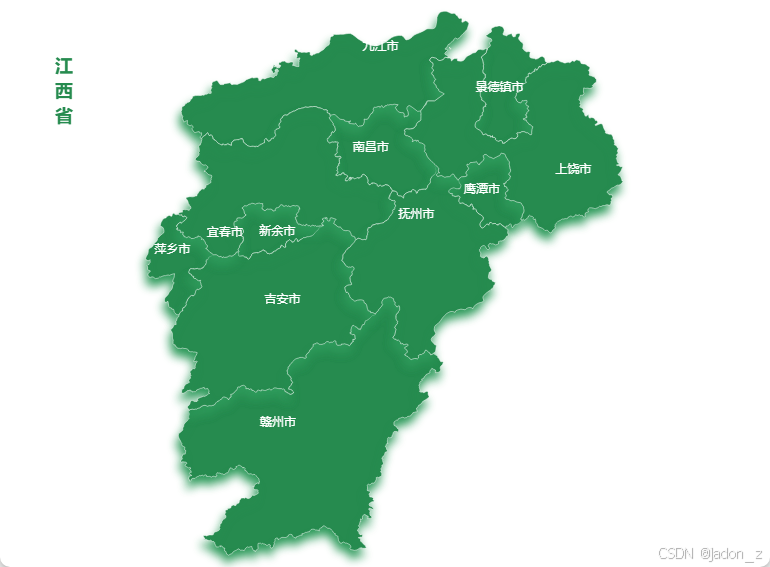
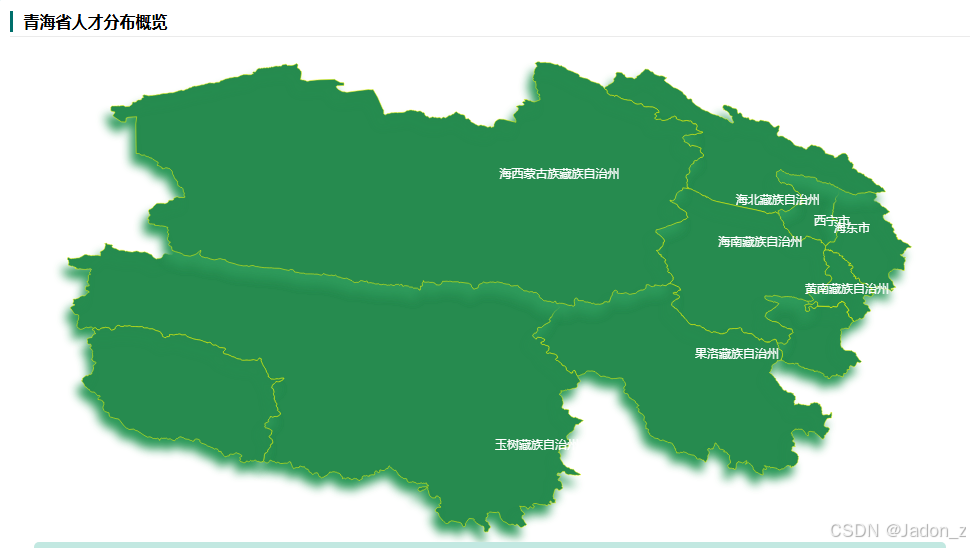
vue项目,基于echarts的各省份地图展示
先看效果图:
核心代码:
- 首先在模板中定义一个固定宽高的容器
<template><div class="mapContent"><div id="main" ref="mapContainer"></div></div> </template> - 获取地图json数据(https://gitee.com/winken/echarts-map-json ---ECharts省份地图数据合集)
- 将地图json数据引入到项目中
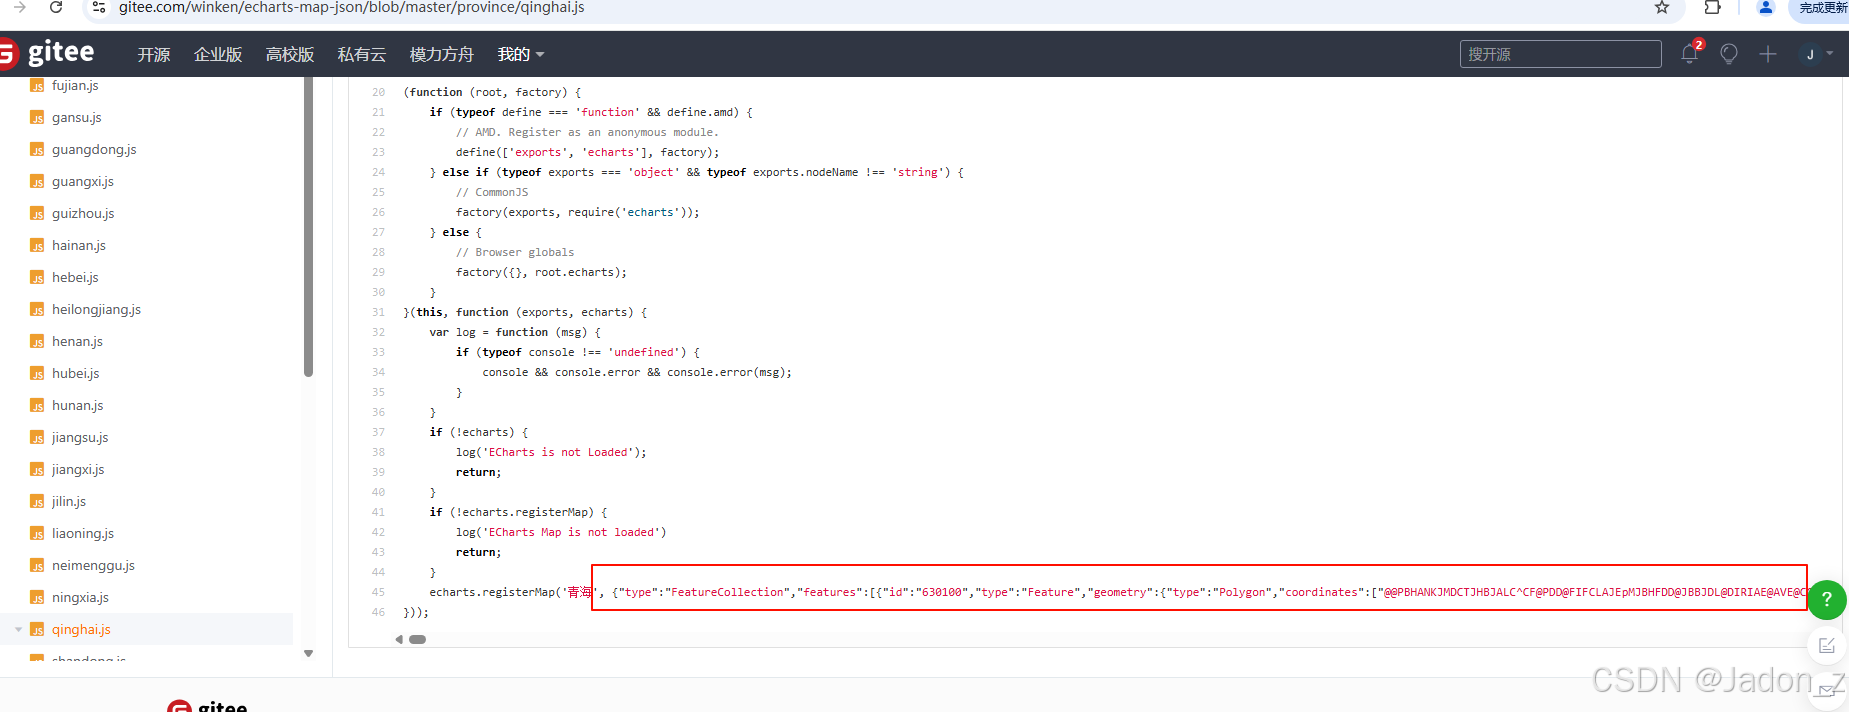 这里我单独创建了一个js文件来定义json
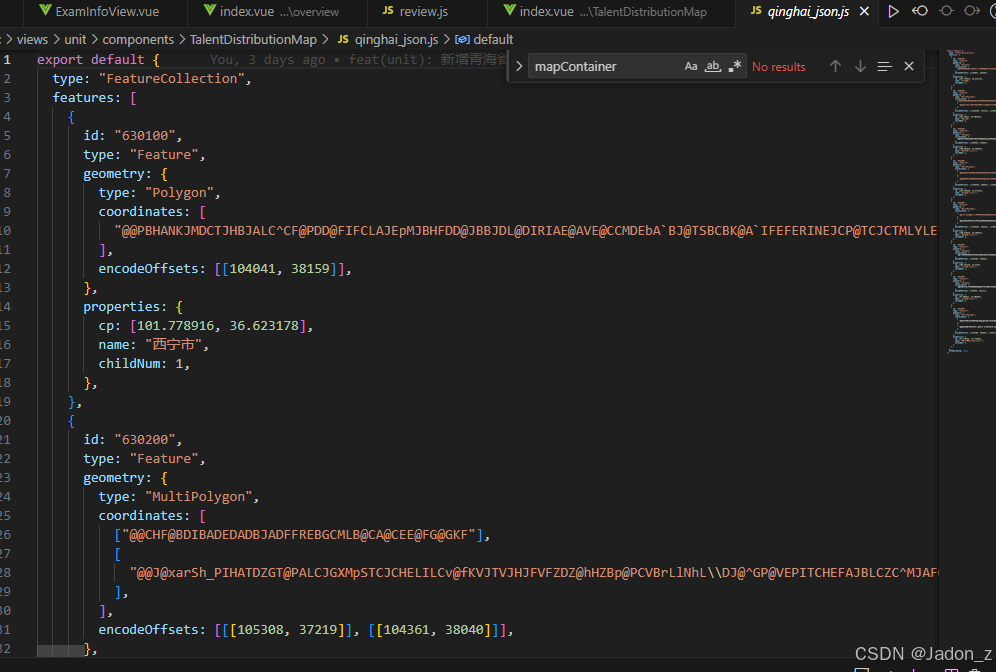 然后在vue文件中引入
 import qinghai_json from './qinghai_json'; - 初始化地图配置
export default {data() {return {mapOption: mapQh, // 地图配置数据}}
}
// 青海地图配置 export const mapQh = {backgroundColor: "transparent",animation: true,title: {show: false,text: "青\n海\n省",subtext: "",x: "50px",y: "50px",textStyle: {color: "#268b4f",lineHeight: 25,textShadow: "",},},//左侧小导航图标visualMap: {show: false,x: "left",y: "center",splitList: [],inRange: {},color: ["#5475f5", "#9feaa5", "#85daef", "#74e2ca", "#e6ac53", "#9fb5ea"],},color: ["#268b4f", "#268b4f", "#268b4f", "#268b4f", "#268b4f"], //3066ba//配置属性series: [{name: "青海",type: "map",map: "qinghai",roam: true,zoom: 1.2,aspectScale: 1,colorBy: "data", //按照数据分配颜色label: {show: true, // 各地市名称fontSize: 12,color: "#fff",align: "center",position:'inside',verticalAlign:"middle"},data: [],itemStyle: {borderWidth: 0.5, //边际线大小borderColor: "#FFFF00", //边界线颜色shadowColor: "#2f9b5c", // 省份边框阴影shadowBlur: 10, // 省份边框聚焦shadowOffsetX: -5,shadowOffsetY: 10,},emphasis: {show: true,areaColor: "#FFFF00", //鼠标滑过区域颜色label: {show: true,color: "#000",},},select: {itemStyle: {borderColor: "#FFFF00",borderWidth: "1",areaColor: "#FFFF00", //设置地图点击后的颜色color: "#000",label: {show: true,color: "#000",align: "center",},},},zlevel: 1,},], }; - js中初始化地图
<script>
import * as echarts from 'echarts';
export default {methods: {/**初始化地图 */initMap() {const chart = echarts.init(this.$refs.mapContainer);echarts.registerMap('qinghai', qinghai_json);chart.setOption(this.mapOption);window.addEventListener('resize', () => chart.resize());} }
}
</script>