【Python】Matplotlib:立体永生花绘制
本文代码部分实现参考自CSDN博客:https://blog.csdn.net/ak_bingbing/article/details/135852038
一、引言
Matplotlib作为Python生态中最著名的可视化库,其三维绘图功能可以创造出令人惊叹的数学艺术。本文将通过一个独特的参数方程,结合极坐标系转换与动画技术,演示如何用代码"栽培"一朵永恒旋转的立体永生花。该作品展现了数学之美与编程创意的完美结合。
二、实现原理
2.1 参数方程设计
永生花的形态由以下核心方程构建:
- 时间维度:
t从-4π到26π渐变,形成螺旋生长轨迹 - 衰减函数:
p = (π/2)*exp(-t/(8π))控制花瓣的展开程度 - 振荡函数:
change = sin(20t)/50添加自然卷曲效果 - 形态函数:
u = 1 - (1 - mod(3.3t, 2π)/π)^4/2 + change生成花瓣的波浪边缘
2.2 坐标变换
通过极坐标转换实现三维曲面:
x = linspace(0, 1, res_x)  # 径向采样
t = linspace(-4π, 26π, res_t)  # 角度采样
r = 1.5*u*(x*sin(p)+y*cos(p))  # 极径计算
h = u*(x*cos(p)-y*sin(p))      # 高度计算
X, Y = r*cos(t), r*sin(t)      # 转换为笛卡尔坐标
三、代码实现
3.1 曲面生成
def generate_surface(res_x=25, res_t=1151):"""生成极坐标曲面数据"""x, t = np.meshgrid(np.linspace(0, 1, res_x),np.linspace(-4 * np.pi, 26 * np.pi, res_t))p = (np.pi / 2) * np.exp(-t / (8 * np.pi)) # 衰减函数change = np.sin(20 * t) / 50 # 振荡修正项u = 1 - (1 - np.mod(3.3 * t, 2 * np.pi) / np.pi)**4 / 2 + changey = 2 * (x**2 - x)**2 * np.sin(p) # 纵向偏移r = 1.5 * u * (x * np.sin(p) + y * np.cos(p)) # 极径计算h = u * (x * np.cos(p) - y * np.sin(p)) # 高度计算return r * np.cos(t), r * np.sin(t), h # 笛卡尔坐标转换
3.2 动画创建
def create_animation(xyz, elev=30, angle_step=2, interval=50):"""创建3D自动旋转动画"""fig = plt.figure(figsize=(8, 8))ax = fig.add_subplot(projection='3d')# 绘制彩色曲面ax.plot_surface(*xyz, cmap='magma', linewidth=0, antialiased=True)# 可视化优化ax.set_axis_off()plt.title('永生花开映挚爱', fontsize=16)# 动画旋转逻辑def _rotate(angle):ax.view_init(elev=elev, azim=angle)# 创建动画对象ani = animation.FuncAnimation(fig, _rotate,frames=np.arange(0, 360, angle_step),interval=interval)plt.show()
四、效果展示
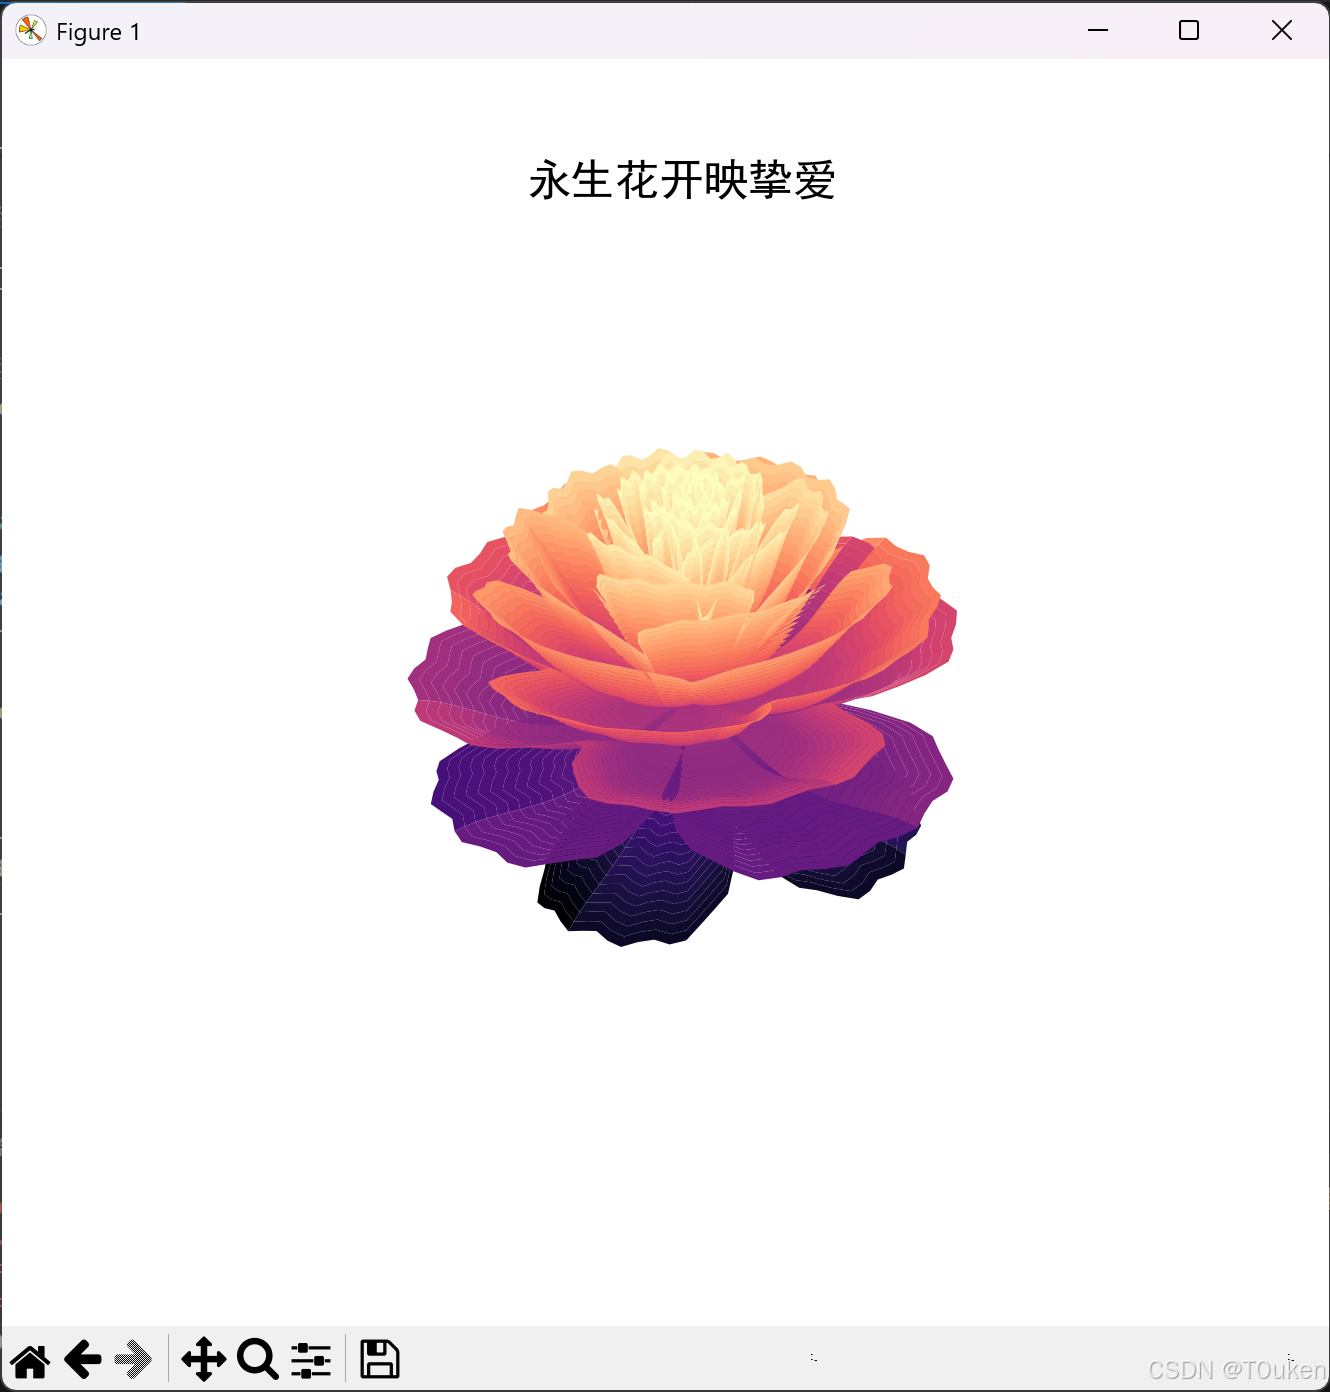
- 色彩映射:使用
magma色板实现熔岩渐变效果 - 动态效果:通过每50ms旋转2度实现平滑转动
- 视觉优化:
- 隐藏坐标轴(
set_axis_off()) - 抗锯齿处理(
antialiased=True) - 白色背景配置
- 隐藏坐标轴(
五、源码展示
import numpy as np
import matplotlib.pyplot as plt
from matplotlib import animation# 配置全局参数
plt.rcParams.update({'font.sans-serif': ['SimHei'],  # 中文字体'axes.facecolor': 'white',      # 坐标背景'savefig.facecolor': 'white'
})def generate_surface(res_x=25, res_t=1151):"""生成极坐标曲面数据"""x, t = np.meshgrid(np.linspace(0, 1, res_x),np.linspace(-4 * np.pi, 26 * np.pi, res_t))p = (np.pi / 2) * np.exp(-t / (8 * np.pi))change = np.sin(20 * t) / 50u = 1 - (1 - np.mod(3.3 * t, 2 * np.pi) / np.pi) ** 4 / 2 + changey = 2 * (x**2 - x)**2 * np.sin(p)r = 1.5 * u * (x * np.sin(p) + y * np.cos(p))h = u * (x * np.cos(p) - y * np.sin(p))return r * np.cos(t), r * np.sin(t), hdef create_animation(xyz, elev=30, angle_step=2, interval=50):"""创建并播放3D自动旋转动画"""fig = plt.figure(figsize=(8, 8))ax = fig.add_subplot(projection='3d')# 绘制曲面ax.plot_surface(*xyz, cmap='magma', linewidth=0, antialiased=True)# 隐藏坐标轴和刻度ax.set_axis_off()plt.title('永生花开映挚爱', fontsize=16)# 旋转函数def _rotate(angle):ax.view_init(elev=elev, azim=angle)ani = animation.FuncAnimation(fig, _rotate,frames=np.arange(0, 360, angle_step),interval=interval)plt.show()if __name__ == '__main__':xyz = generate_surface()create_animation(xyz)
六、总结
本文通过数学参数方程与Matplotlib三维可视化功能的结合,实现了一个富有艺术美感的数字永生花。该案例展示了如何将:
- 极坐标系转换
- 参数化曲面生成
- 三维动画控制
等关键技术有机结合。读者可通过调整方程参数或更换色板(如viridis、plasma),创造出独具个人风格的数字花卉。
完整代码及运行环境要求见原文开头部分。建议在Jupyter Notebook或支持交互绘图的IDE中运行以获得最佳动画效果。